№ 066 · Deep Dive · · 10 min
Japan’s Lost Decades: What Long-Term Investors Should Actually Take Away
Learn what Japan's 34-year wait for its 1989 peak teaches about diversification and valuation, and what it means for your US-heavy portfolio today.

Japan’s lost decades teach one durable lesson. A single country bought at an extreme valuation can deliver very little for a generation, and the most reliable defense is to own many markets at once. The Nikkei 225 peaked at the end of 1989 close to 39,000, lost the large majority of its value by the global financial crisis, and did not set a new record close until February 22, 2024, more than 34 years later. For a portfolio that is mostly US equities with the Shiller CAPE near 41 as of October 2026, the takeaway concerns concentration and starting price, with no collapse forecast attached.
I checked the current figures in this piece against live S&P 500 price data and Shiller CAPE readings pulled in October 2026, and the historical drawdown numbers against a verified table of S&P 500 bear markets. The Japan story is often told as a horror tale or dismissed as irrelevant. Both versions miss what the episode actually shows.
What Happened to Japanese Stocks After 1989?
Between the mid-1980s and the end of 1989 the Nikkei roughly tripled, powered by cheap credit, soaring land values, and a belief that Japanese corporations had rewritten the rules of competition. The market traded at an extraordinarily high multiple of earnings at the peak, a level that left no room for ordinary disappointment. Property and equities served as collateral for each other, so when one fell the other followed, and the banking system that had financed both spent years repairing its balance sheet.
The decline came in stages. Prices fell sharply in the early 1990s, rallied, fell again, and reached their lows around the global financial crisis, far below the 1989 close. Growth slowed, deflation set in, and interest rates sat near zero for long stretches. Equity investors had been paid in advance for a decade of growth that then arrived slowly or not at all.
Valuation appears to have done much of the damage. Many Japanese companies went on to build excellent global franchises, yet shareholders who paid 1989 prices bought those franchises at a level that no realistic stream of profits could justify. The same arithmetic runs through every bubble. Pay more, get less is a principle of compounding that applies to countries as much as to companies.
How Long Did the Nikkei Take to Recover Its 1989 Peak?
The Nikkei took more than 34 years to close above its December 1989 high, finally doing so on February 22, 2024. Press reports put the index at 70,683.98 on October 6, 2026, so an investor who bought the peak and held on is now up roughly 80 percent in price terms, or under 2 percent a year before dividends and without adjusting for the mild deflation Japan experienced.
Those price-only figures flatter the pessimists and understate the case for patience at the same time. Dividends, which Japanese companies paid at low but positive rates, shortened the real recovery time for anyone who reinvested them, and deflation raised the purchasing power of a flat nominal index. Even so, the wait dwarfs anything the US has produced. According to verified S&P 500 data, the slowest US recoveries were the dot-com crash, with a 49 percent peak-to-trough decline and about 384 weeks to regain the high, and the 1973-74 bear market, down 48 percent with a 374-week recovery. Roughly seven and a half years is a long time to wait. Thirty-four years is a different category of experience, and it ends careers and retirements.
Diversification offers little protection against a bad day or a bad year. Its value shows up in the bad decade, when one market goes nowhere and the others keep compounding.
What Did a Globally Diversified Investor Actually Experience?
An investor who held a global cap-weighted portfolio through 1990 took a real hit, because Japan made up a very large share of the world equity index at the peak, by some estimates 40 percent or more. The rest of that portfolio, however, was invested in the US, Europe, and other markets that spent the 1990s compounding at healthy rates. The Japanese slice shrank as its price fell, and a cap-weighted index trims a falling market without anyone making a decision. Japan’s weight in the major global indices today is a small fraction of its 1989 level.
That mechanism answers a common objection. Critics say a world index forces you to buy whatever is hottest, and in 1989 that was Japan. True, and the index absorbed the loss, but it also kept the investor alive in the markets that came next. A saver who owned only Japan had no such cushion. A Japanese household with all its equity wealth at home, and a pension tied to the same economy, experienced the lost decades in full.
The behavioral version of this risk now runs the other way for Americans. Home bias feels safe because the companies are familiar and the recent record is excellent. The US accounts for more than half of global equity market capitalization, so a world index already leans heavily toward it. An investor who holds only US stocks has made the same kind of country bet that Japanese investors made in 1989, from a different starting point and with very different recent history.
Was Stock Picking the Answer in Japan?
Stock picking was not the main answer. Individual selection inside a market that falls so far can work, since Japan always had excellent businesses, but finding them in advance and holding them through two decades of discouraging headlines is a feat very few professionals manage. Evidence from the Japanese experience suggests that value and small-cap tilts fared far better than the cap-weighted index after the bubble burst. That supports factor diversification inside a broad portfolio, and it leaves country risk untouched.
Warren Buffett is a useful reference here, because his record is sometimes read as a case for picking winners. His edge lay in price discipline and patience, as we discuss in Buffett’s Real Edge Wasn’t Stock Picking, It Was Patience. Berkshire Hathaway built a meaningful Japanese position only decades after the bubble, once valuations there had reset. The same companies could have been a poor purchase at one valuation and a sound one at another, which is why the entry price matters more than the decision to buy.
Broad ownership removes the need to be right about which country or company wins. Low-cost index funds, which we compared in Index Funds vs. ETFs, make that exposure cheap to hold and simple to rebalance. The intellectual work belongs in asset allocation and valuation awareness, and individual stock decisions matter far less than either.
Could a US-Heavy Portfolio Face a Japan-Style Lost Decade?
A US-heavy portfolio could face a decade of poor returns, and valuation makes that outcome more likely than it would be from a cheaper starting point. A literal repeat of Japan, with a drawdown of that depth and a 34-year wait, is a far thinner tail, because the US does not share Japan’s particular mix of land-backed credit, fragile banks, and deflation. The closer comparison is the dot-com era, which cost US investors 49 percent and about seven and a half years.
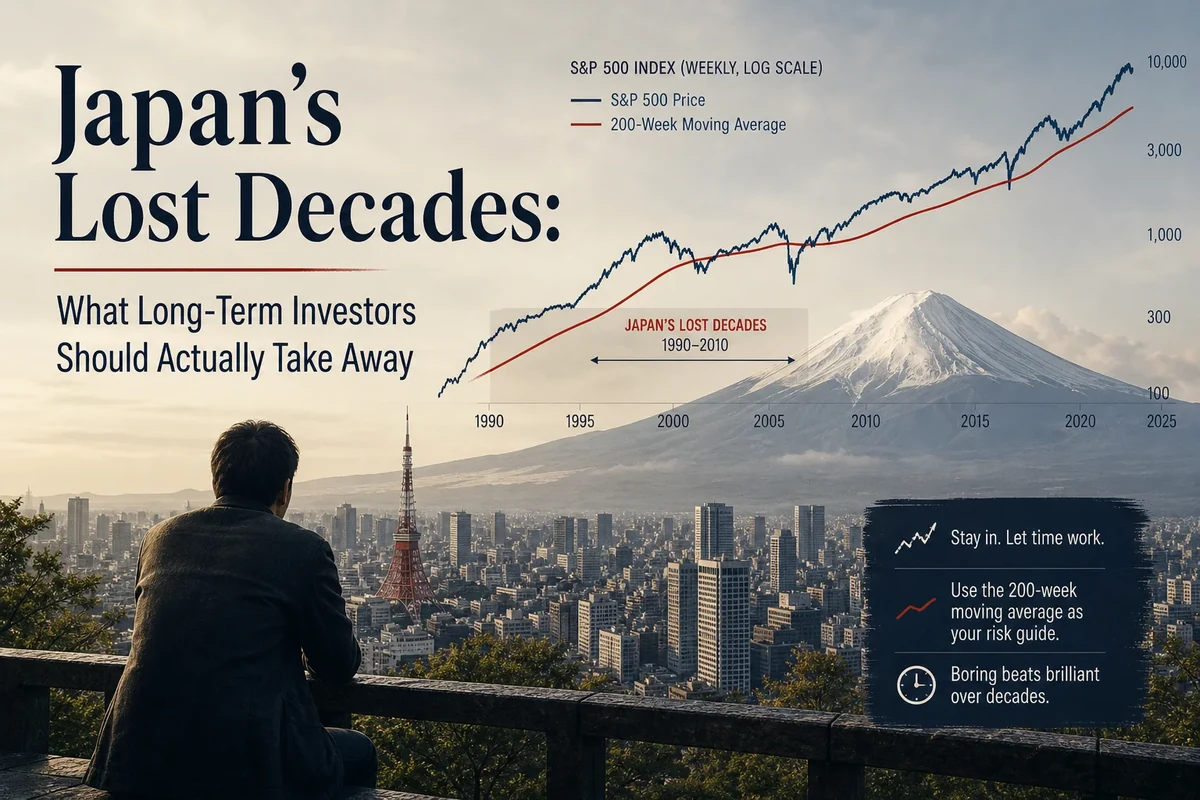
As of October 2026, the numbers frame the question clearly. The S&P 500 trades at about 7,751, against a 200-week SMA of about 5,745, which puts the index roughly 35 percent above its long-cycle average. Its 52-week range runs from about 6,317 to 7,845, so it sits near the top of that range. The Shiller CAPE reads 40.86 (as of October 20, 2026), compared with a long-run mean in the mid-teens, a 2000 peak near 44, and a 2021 reading close to 40. The Buffett indicator, using a static GDP anchor that makes it approximate, puts total US equity value at about 253 percent of GDP, which is dot-com territory by that measure.
The 10-year Treasury yield adds another layer. At about 5.1 percent as of October 2026, it sits well above the earnings yield implied by the CAPE, which is roughly 2.4 percent (one divided by 40.86). Investors are accepting less income from equities than from government bonds and relying on strong earnings growth to close the gap. That can happen, and the US has a record of high-margin, globally dominant companies that Japan in 1989 lacked. It requires a lot to go right. Our look at how valuation shapes the next decade covers why this matters for expected returns even though it says little about next quarter.
Two caveats keep this honest. The CAPE has sat above its old average for long stretches of recent decades, partly because of higher profit margins and a different sector mix, so a reading near 41 does not mean a crash is scheduled. And Japan’s lost decades took a start from extreme overvaluation combined with a long period of weak earnings growth. Good outcomes from high valuations are possible when earnings surprise upward, and rare enough that planning on them is a bet, not a base case.
What Should Long-Term Investors Do With This Lesson?
A baseline that deserves genuine respect is a globally diversified equity core held in broad index funds, with a bond or cash allocation sized to your actual needs rather than your mood. Holding global market weights means accepting a large US position, which is reasonable given the size and quality of the US market. A modest additional tilt toward non-US developed and emerging markets can be defended on valuation grounds today, and the stronger case rests on reducing the chance that one country’s story decides your retirement.
Rebalancing turns diversification into a working discipline. When one market runs far ahead, trimming it and adding to laggards sells some of what has become expensive and buys some of what has become cheap, with no forecast required. Dollar-cost averaging of new savings does similar work during accumulation, since it keeps contributions flowing at whatever price the market offers. Neither technique prevents a lost decade in a single market. Both make a lost decade in one market a survivable event for the whole portfolio.
The 200-week SMA fits this framework as a regime gauge rather than a verdict. A long-cycle average would likely have flagged the Nikkei’s break in the early 1990s, well before the worst of the damage, and discouraged an investor from treating a falling market as a bargain. Today’s reading, with the S&P 500 about 35 percent above its average, shows the opposite condition, an index with little valuation cushion beneath it. Our guides to what the 200-week SMA measures and the Buy the 200 strategy explain how to use that information to size new purchases patiently, and our history of S&P 500 readings against the 200-week average puts the current gap in context.
Starting valuation sets the odds for the next decade, and diversification sets how badly one wrong country can hurt you. Neither requires predicting when anything happens.
None of this requires pessimism about the US. American companies may well keep earning extraordinary returns on capital, and a world index will capture them. The Japanese lesson asks for humility about the price paid and the number of baskets held. An investor who owns the whole world at sensible weights, rebalances, and keeps saving has no need to guess whether the next lost decade arrives in Tokyo, New York, or somewhere nobody is watching.
Frequently Asked Questions
Q: How long did it take the Nikkei to recover its 1989 high?
A: The Nikkei 225 peaked at the end of 1989 and first closed above that level on February 22, 2024, a wait of more than 34 years in price terms. Reinvested dividends and mild deflation shortened the effective recovery somewhat for long-term holders.
Q: Does Japan prove that stocks do not always go up over the long run?
A: Japan shows that a single market bought at an extreme valuation can stagnate for decades. A globally diversified portfolio over the same period still compounded, because the US, Europe, and other regions grew while Japan stalled.
Q: Could the S&P 500 have a lost decade like Japan’s?
A: A flat decade is plausible from a Shiller CAPE near 41 as of October 2026, and the dot-com bust, which fell 49 percent and took about 384 weeks to recover, is the closest US precedent. A full Japanese repeat is less likely because US conditions differ, though high valuations do lower expected returns.
Q: How should a US-heavy investor respond to the Japan lesson?
A: Holding a global cap-weighted index fund spreads country risk automatically, and a modest extra tilt toward non-US markets reduces dependence on one economy. Regular rebalancing and steady contributions keep the portfolio resilient without any forecast.