№ 023 · Market Analysis · · 12 min
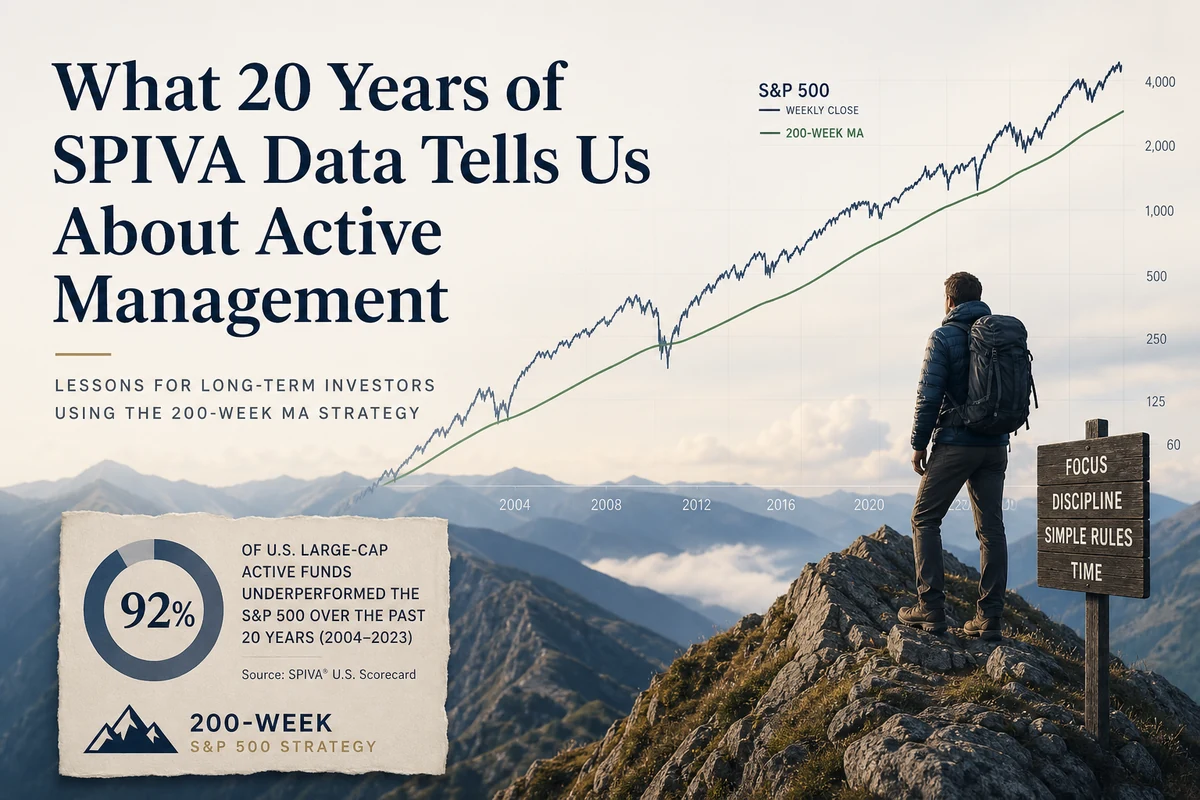
What 20 Years of SPIVA Data Tells Us About Active Management
S&P's SPIVA scorecard has tracked active vs. passive for over two decades. The verdict is consistent, global, and harder to argue with every year. Here's what the data actually says.

The S&P Indices Versus Active (SPIVA) scorecard was first published in 2002, and since then it has done something the fund management industry largely wishes it had not: it has produced a consistent, regularly updated, survivorship-bias-adjusted record of how active fund managers actually perform against their benchmarks. Not in marketing materials. Not in cherry-picked three-year windows. Across full market cycles, across asset classes, and across regions. The data has now accumulated for more than two decades, and the central finding has not changed direction once.
What SPIVA Measures and Why It Matters
SPIVA tracks whether actively managed funds beat their stated benchmark index, net of fees, over periods ranging from one to twenty years. What separates it from a simple performance comparison is survivorship bias correction. When a fund closes, merges into another vehicle, or is quietly absorbed because it performed poorly, that fund’s record disappears from most standard databases. Investors comparing active to passive using only live funds are looking at a survivors-only sample, which systematically flatters active management because the failures have been removed from the comparison pool.
According to Tim Edwards, Managing Director and Global Head of Index Investment Strategy at S&P Dow Jones Indices, a substantial share of active funds do not survive a ten-year period. Research discussed in the SPIVA context suggests that only around half to three-fifths of active funds remain open after a decade. That means any analysis of active manager performance that ignores closed funds is working from a heavily filtered sample. SPIVA accounts for those failures, which is why its results tend to be more damning than what you would find by simply ranking currently available funds.
Survivorship bias is not a minor technical quibble. When a large share of active funds fail to survive a decade, a comparison built only on surviving funds is, by construction, a comparison built on the better portion of the original group.
The methodology has faced academic scrutiny, and while researchers have proposed refinements, the directional conclusion has held up. Independent academic reviews of SPIVA’s approach have found that, while methodological adjustments can shift specific numbers, the study is directionally sound: passive funds generally outperform active funds in the long run, and any advantages active funds hold are wiped out by fees.
The Headline Numbers, Honestly Stated
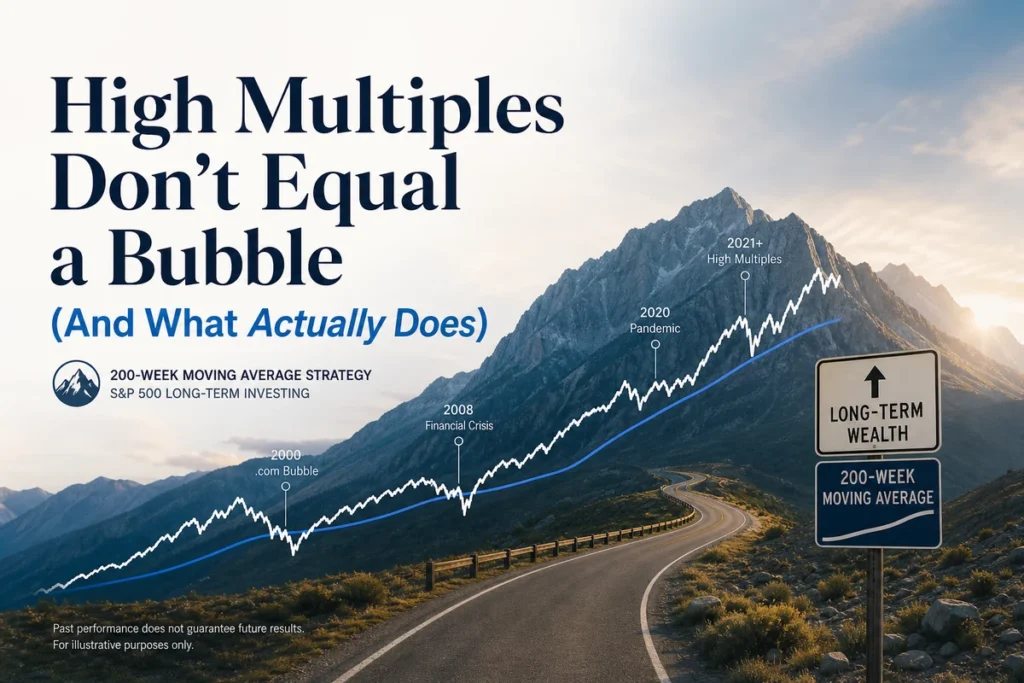
Across the SPIVA US scorecard, the percentage of large-cap active equity funds that underperform the S&P 500 rises consistently as the measurement horizon extends. Over a single year, some active funds beat the index, and the split can appear almost competitive. Over five years, the majority of active funds fall behind. Over ten and fifteen years, the underperformance rate climbs toward and often above 80 to 90 percent of active funds in most categories. This pattern is not a recent phenomenon driven by one long bull market. It has held across multiple full market cycles, including the dot-com collapse, the 2008 financial crisis, and the sharp swings of 2020 and 2022.
The numbers for mid-cap and small-cap active funds are slightly more competitive over shorter horizons, but the same compression toward majority underperformance appears as the time horizon extends. International equity active funds, covering developed markets outside the US, show the same pattern when measured against MSCI World and regional benchmarks. The SPIVA Europe scorecard and SPIVA reports covering Latin America, Canada, Australia, and emerging markets consistently show that most active funds across most categories trail their benchmarks over periods longer than five years.
What this means for a serious long-term investor is straightforward: the further out you intend to hold an investment, the more the odds compound against you when you choose active management over a low-cost index fund tracking the same market.
Why Underperformance Is Mathematically Predictable
The economist William Sharpe articulated the core logic in what he called the arithmetic of active management. Before costs, the aggregate return of all active investors must equal the market return, because together they hold the market. There is no other mathematical possibility. For every active investor who outperforms, another must underperform by the same amount. The total is fixed. After costs, active investors as a group must underperform the market by an amount equal to their aggregate costs. Index funds, which carry substantially lower costs, capture close to the full market return. Active funds, which carry management fees, research costs, trading commissions, and often distribution charges, must deliver less in aggregate than the index. This is not a theory or a conjecture. It is arithmetic, and it applies regardless of market conditions, interest rate environments, or how much volatility the year happens to contain.
The practical gap between active and passive costs has narrowed over the past two decades, but it has not closed. Broad US equity index funds now routinely carry expense ratios below 0.10 percent. Actively managed equity funds typically charge between 0.50 and 1.00 percent or more, and in some markets, particularly outside the United States and in certain fund distribution channels, active fund fees remain considerably higher. That annual cost differential, compounded over fifteen or twenty years, creates a performance gap that the average active manager cannot bridge through stock selection alone.
The Persistence Problem
A reasonable response to the aggregate data is to argue that most active funds underperform, but skilled investors can identify the minority that outperform and concentrate their holdings there. SPIVA publishes a separate persistence scorecard specifically to test this argument, and the results are consistent: past top-quartile performance offers almost no reliable prediction of future top-quartile performance.
Across multiple measurement periods, the share of previously top-quartile funds that remain in the top quartile in the following period is close to what you would expect by random chance. A meaningful proportion of former top performers fall into the bottom half or the bottom quartile in subsequent periods. This result is not saying that skill is impossible. It is saying that identifying skilled managers in advance, using the only information actually available to investors, which is past performance, has historically proven close to unreliable.
Picking last year’s top fund is not a strategy. It is a bet that the conditions that produced last year’s outperformance will repeat in exactly the way the manager happened to be positioned for, and that the manager’s edge, if it was real, has not already been competed away.
There is a subtler version of this problem involving closet indexers. Research using the Active Share metric, which measures how much a fund’s holdings actually differ from its benchmark, found that a significant portion of actively managed funds hold portfolios that substantially overlap with their benchmark index while charging active management fees. These funds are, almost by construction, destined to underperform net of fees: they provide most of the index return while subtracting active management costs from it.
Where Active Management Has a Legitimate Case
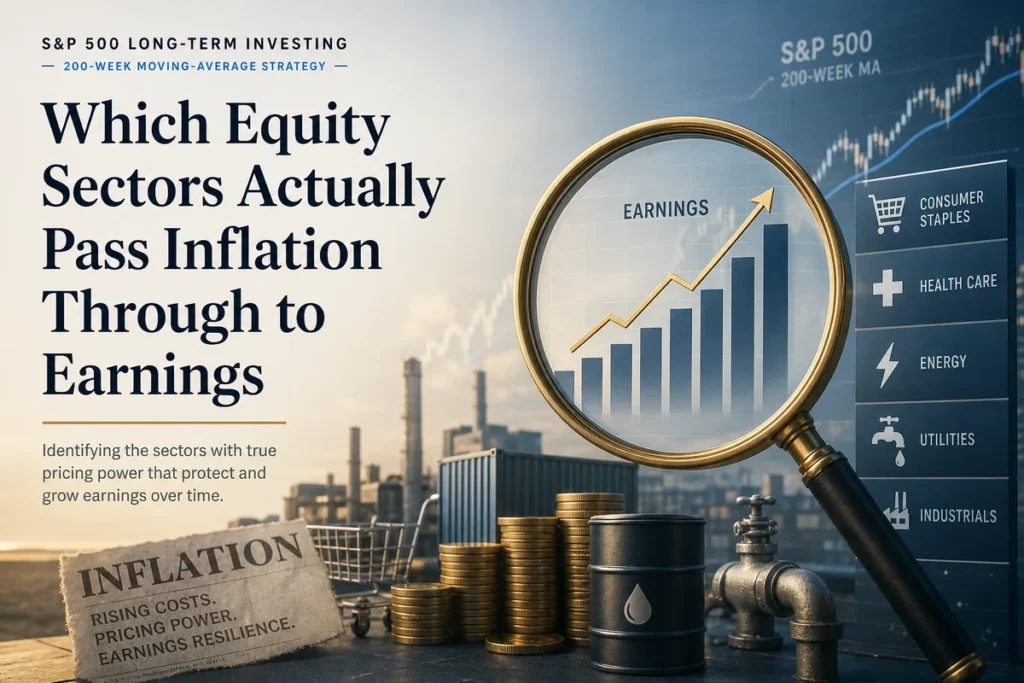
An honest reading of SPIVA data does not suggest that active management adds zero value in every context. There are market segments where the conditions for active outperformance are at least more plausible, and where the scorecard results, while still mixed, are less one-sided than they are for US large-cap equity.
Small-cap equities represent one such area. The argument is structural: large institutional investors cannot easily take meaningful positions in micro- and small-cap companies without moving the price against themselves. Analyst coverage is thinner. Information asymmetries between insiders and outside investors are larger. A disciplined active manager with genuine research capacity and the willingness to hold genuinely unconventional positions can, in theory, find mispriced securities more readily than in a market where hundreds of analysts are covering the same names. SPIVA data for small-cap categories tends to show active managers performing relatively better over short horizons, though the persistence problem remains, and over longer periods the underperformance ratio still rises.
Emerging markets present a related case. Price discovery in less liquid, less researched markets is noisier, governance standards are less uniform, and political and currency factors introduce risks that a skilled manager may be able to navigate more dynamically than an index that rebalances mechanically. Evidence on emerging market equity strategies does suggest that active selection within these markets is more likely to generate results than in developed large-cap markets, though the findings are far from uniformly positive and manager selection remains genuinely difficult.
Fixed income is a third area where the case for active management has more texture. Bond indices are constructed in ways that can systematically over-weight the most indebted issuers, and active managers can sometimes exploit duration, credit quality, and sector positioning to generate incremental return. SPIVA data for bond fund categories shows slightly better active outcomes than for equity, though still predominantly underperforming over multi-year horizons. The 2024 SPIVA US results identified certain fixed income categories as areas where active funds showed relatively stronger results, a finding worth monitoring but not yet a reversal of the long-run trend.
What Good Active Management Actually Requires
For active management to add value net of fees, several things need to be simultaneously true. The manager must hold a portfolio genuinely different from the benchmark, since a closet indexer cannot outperform after fees. The manager must have verifiable skill rather than recent luck, and the persistence data makes clear how hard this is to confirm in advance. And the fee must be low enough that outperformance, if generated, is not largely consumed before reaching the investor.
This combination is rare. It is not impossible, but it is rare enough that the base rate argument for passive investing is strong for most investors in most market segments. Committed active investors who understand this and continue to search for genuine edge are not being irrational, but they should hold themselves to a high standard of evidence before concluding they have found it. Identifying a manager who has outperformed for three years is not sufficient. Understanding whether that outperformance came from a verifiable and durable edge, or from a style tilt that happened to be in favor, is considerably harder and requires the kind of due diligence that most retail investors cannot realistically perform.
For investors building a long-term portfolio around the S&P 500 or a global index like the MSCI World, the evidence for owning the index at low cost and staying invested through market cycles is compelling. The primary risks to long-term returns are not manager selection. They are behavioral: selling into bear markets, over-trading, and allowing short-term fear to override a long-term allocation. A passive index fund does not insulate you from those risks, but it removes the additional active management headwind before the behavioral risks even begin.
The cost of active management is guaranteed. The outperformance is not. For most investors in most markets, that asymmetry goes a long way toward settling the question.
The Long-Cycle Context
One legitimate criticism of SPIVA-based arguments is that they are measured during a period, particularly from 2010 onward, when large-cap US growth stocks dominated returns and passive US equity indices were unusually hard to beat. The counter-argument has two parts. First, the SPIVA data covers periods well before the recent growth-dominated era, including decades when value and active management were thought to have strong structural edges, and the pattern of majority underperformance appeared then too. Second, even if market regimes shift and active management performs better in a given decade, the persistence problem means that identifying in advance which active managers will benefit from the regime shift remains unsolved.
Long-cycle investors who use tools like the 200-week moving average as a broad market filter are already operating with a discipline that passive investing reinforces well: reduce exposure during sustained downtrends, hold through normal volatility, and avoid overreacting to short-term noise. The discipline of staying invested in a low-cost index fund closely mirrors the behavioral discipline that the data consistently identifies as a primary driver of long-run returns. Most active management, by contrast, introduces a layer of manager-selection uncertainty that compounds rather than reduces the challenge of maintaining a consistent long-term approach.
Frequently Asked Questions
Q: Does SPIVA prove that no active manager can beat the market?
A: No. SPIVA shows that the majority of active funds underperform their benchmarks over long periods, and that past performance does not reliably predict which minority will outperform in the future. Individual managers with genuine and durable edges do exist. The difficulty lies in identifying them in advance, net of fees, with enough confidence to justify paying for active management.
Q: Are there asset classes where active management still makes sense?
A: The case is strongest in segments with lower analyst coverage, thinner liquidity, and more varied information quality, including smaller-cap equities, emerging markets, and certain fixed income categories. Even in these areas, the majority of active funds still underperform over long horizons, but the margin is narrower and the argument for skilled active management is more grounded in the structural conditions that favor it.
Q: If most active funds underperform, why do so many investors still use them?
A: Several reasons, none of which are flattering to the industry. Survivorship bias makes past results look better than they were. Financial advisers who earn commissions on actively managed funds have an incentive to recommend them. Many investors equate higher fees with higher quality, a reasonable heuristic in most consumer markets but not in fund management, where fees are a drag rather than a signal of value. And the marketing of active funds naturally emphasizes recent outperformance, which is the period least useful for predicting future results.
Q: Does switching to passive investing mean giving up protection in bear markets?
A: Not in any meaningful sense. A passive investor in a broad market index will capture the full decline in a bear market, but research on active funds during bear markets shows mixed results at best. Some active funds hold more cash, which cushions short-term losses but drags on long-run returns. More durable protection in a bear market comes from asset allocation, not manager selection. Holding a combination of equities and bonds suited to your time horizon, and having the discipline not to sell at the bottom, matters considerably more than whether your equity allocation is actively or passively managed.