№ 010 · Education · · 13 min
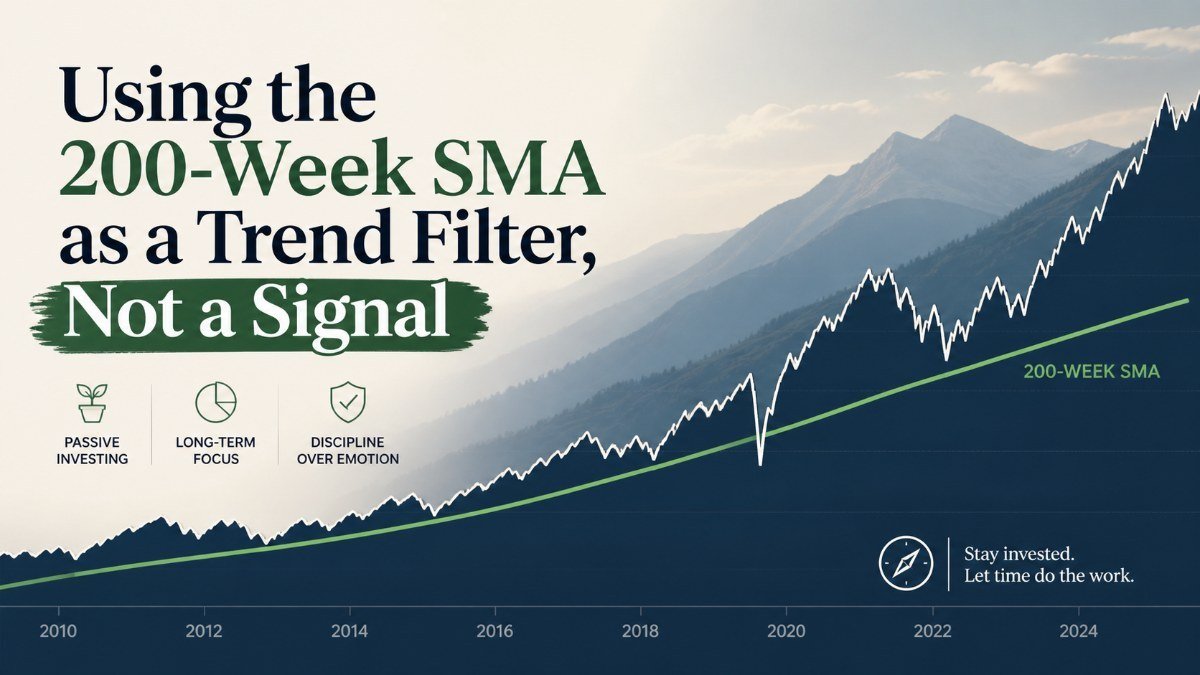
Using the 200-Week SMA as a Trend Filter, Not a Signal
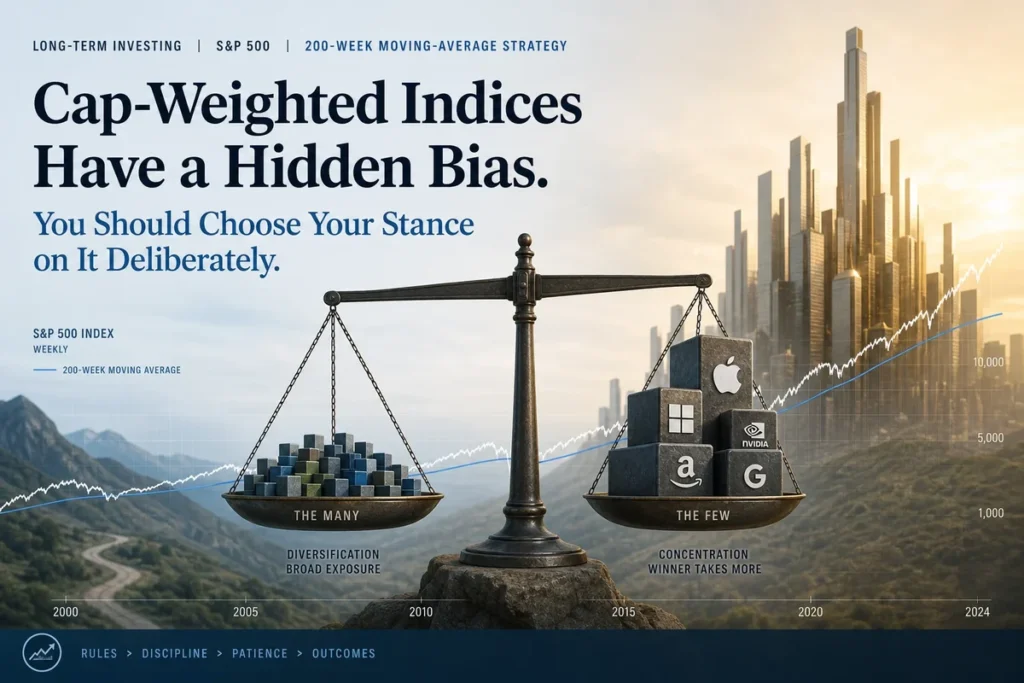
The 200-week SMA is not a buy or sell trigger. Used correctly, it is a regime classifier that changes how strictly you apply fundamental due diligence to every position in your portfolio.

Most investors who discover the 200-week simple moving average make the same mistake. They treat it as a binary switch: price crosses above, you buy; price crosses below, you sell. This is understandable. It feels like a rule, and rules feel safe. But decades of market history suggest the 200-week SMA works very differently in practice. It is not a timing signal. It is a regime classifier, and that distinction changes everything about how you should use it.
The purpose of this article is to explain exactly what that distinction means, why it matters for how you apply fundamental analysis, and how to build a practical framework that treats the 200-week SMA as context rather than command.
The Confusion Between Signal and Context
A signal tells you when to act. Context tells you how to interpret the information you already have. These are related but fundamentally different functions, and conflating them is one of the most common errors in retail technical analysis.
When investors treat the 200-week SMA as a signal, they expect it to generate profits on its own. When they treat it as context, they use it to calibrate the weight they place on other information. The difference in outcomes is significant. An investor using the 200-week as a signal asks: “Did the price just cross the line?” An investor using it as a filter asks: “Given where price sits relative to its four-year average, how much fundamental evidence do I need before acting?”
The 200-week SMA does not tell you what to do. It tells you what kind of environment you are operating in, and that changes the burden of proof you should require from every other piece of analysis you perform.
This framing comes directly from how professional risk managers think about macro regimes. The question is never simply “is this cheap?” or “is this trending?” The question is always “cheap or trending relative to what backdrop?” The 200-week SMA provides a disciplined, historically grounded answer to that backdrop question.
How the 200-Week SMA Differs From Shorter Cycles
The 50-day and 200-day moving averages are widely used tactical tools. They respond to momentum shifts over weeks and months and are most useful for position traders managing intermediate-cycle risk. The 200-week SMA is a different animal entirely.
At roughly four years of price memory, the 200-week SMA captures structural shifts in valuation regime and risk appetite. It smooths through earnings cycles, election cycles, Federal Reserve tightening and easing cycles, and most geopolitical shocks. What remains is the underlying direction of long-term capital allocation. When price is comfortably above this line, it reflects a sustained period in which investors have been willing to pay more for future earnings. When price is below it, the opposite is true: capital has been systematically repriced to the downside over multiple years.
This is why the 200-week SMA responds poorly to short-term manipulation. A single quarter of earnings beats will not move it. A central bank pivot announcement will not move it. A viral narrative around a sector will not move it. It moves when the fundamental reality of an asset class has changed over an extended period, which is precisely why it is useful as a regime indicator rather than a momentum signal.
Above the 200-Week: When Margin-of-Safety Discipline Gets Tighter
Counterintuitively, the period when assets are trading well above their 200-week SMA is the period that demands the most rigorous fundamental discipline, not the least. This is where many investors make a quiet but expensive mistake.
When an asset has been above its four-year average for an extended period, sentiment is permissive. Analysts revise estimates upward. Multiple expansion has often already occurred. The forward P/E or EV/EBITDA that looked expensive twelve months ago now looks acceptable because everyone has grown accustomed to elevated valuations. This is precisely the environment in which Buffett and Munger’s margin-of-safety requirement becomes most operationally important, not because disaster is imminent, but because the cost of being wrong is highest when price has already moved significantly in your favor.
In practical terms, a position trading above its 200-week SMA should be subject to stricter ongoing scrutiny on three dimensions. First, earnings quality: are margins expanding on volume growth, or are they being supported by accounting choices and buyback-inflated EPS? Second, balance sheet trajectory: is leverage declining as earnings grow, or is the company taking on debt to fund a multiple that assumes indefinite growth? Third, free cash flow conversion: is reported earnings translating into actual cash generation, or is working capital consuming the headline numbers?
None of these questions are new. What the 200-week regime context adds is the reminder that the market will not forgive disappointments in this environment with the same patience it might show during a bear cycle. Sentiment reversals from above the 200-week tend to be fast and severe because they require investors to simultaneously reprice both the earnings outlook and the multiple.
Below the 200-Week: Why Valuation Alone Is Not Enough
The symmetrical error is buying on valuation alone when an asset is trading below its 200-week SMA. This is where deep-value investing, applied without regime awareness, produces some of its worst outcomes.
An asset trading below its four-year average has typically done so for a reason that extends beyond temporary market sentiment. Research suggests, and Morningstar’s work on deep-value traps has consistently reinforced, that a meaningful share of stocks trading 30% or more below their long-term average face structural challenges that simple mean reversion will not resolve. The business model may have been disrupted. The competitive moat may have narrowed. The balance sheet may have deteriorated to the point where equity holders bear real impairment risk before recovery occurs.
Below the 200-week SMA, statistical cheapness is not an edge. The edge comes from correctly identifying whether the business is stabilizing or continuing to deteriorate, and that requires qualitative judgment that a price-to-earnings ratio cannot provide.
This does not mean you never buy below the 200-week. Many of the best long-term entry points in market history have occurred precisely in this zone. The S&P 500 crossed back above its 200-week SMA in 2009 and again during the recovery period after 2020. Investors who bought during those regimes and held for years captured exceptional returns. But note the key word: investors who bought during those regimes were not buying on valuation alone. They were buying after identifying evidence of business stabilization, balance sheet durability, and the beginning of a fundamental rerating. The 200-week context told them the risk was elevated. The fundamental work told them the specific assets they were buying could survive and eventually recover.
Why the 200-Week Works Better With Fundamentals Than Alone
There is a straightforward reason why the 200-week SMA used in isolation produces unreliable results: it cannot distinguish between a regime where earnings have legitimately collapsed and a regime where sentiment has overshot legitimate earnings concerns. Both scenarios produce assets below the moving average. Only one of them resolves favorably for equity holders over a reasonable holding period.
Consider two historical periods. During 2000 to 2002, a significant portion of the technology sector traded below its long-term averages. Many of those companies had never produced positive free cash flow and had business models that did not survive the collapse in venture capital and advertising spending. Buying the valuation compression, absent fundamental analysis, meant holding through a permanent impairment, not a temporary dislocation.
By contrast, during late 2008 and early 2009, many high-quality industrial and financial businesses traded below their 200-week SMAs not because their businesses were structurally broken but because systemic credit fear had applied an indiscriminate discount to every asset class. Investors who had done the fundamental work to identify which balance sheets were durable enough to survive the credit contraction were rewarded significantly over the following years. The 200-week context told them the regime was adverse. The fundamental analysis told them which assets deserved buying despite that adversity.
This combination, regime awareness from the moving average and business quality assessment from fundamental analysis, is more powerful than either tool used independently. Research from systematic asset managers including AQR has historically supported the idea that trend-following signals combined with quality and value factors produce more consistent risk-adjusted outcomes than any single factor applied alone.
Building a Dual-Layer Portfolio Filter
Translating this framework into a practical portfolio process requires defining different fundamental hurdle rates for assets in different regime buckets. This is less complicated than it sounds, and it does not require constant monitoring or active trading.
For holdings in the risk-on bucket, meaning assets trading above their 200-week SMA, apply tighter standards across three metrics. Require positive free cash flow yield relative to the risk-free rate. Require stable or declining net debt to EBITDA ratios. Require that earnings growth is being confirmed by actual revenue growth, not purely margin or buyback mechanics. If a position fails these tests, the 200-week regime context makes the case for trimming to target weight at the next rebalancing date.
For holdings in the risk-off bucket, meaning assets trading below their 200-week SMA, apply a different set of standards before adding exposure. Require evidence of stabilizing revenues over at least two consecutive quarters. Require that the balance sheet can survive two to three more years of operating stress without requiring dilutive equity issuance. Require a clear and credible path to free cash flow generation, not a theoretical one based on best-case assumptions. If those criteria are met, the below-average price creates the margin of safety that makes the risk worth taking.
The key insight is that you are not changing your fundamental principles across regimes. You are changing the threshold of evidence required before acting. This prevents both overtrading in bull regimes and complacency about deteriorating fundamentals in bear regimes.
Common Pitfalls: False Breakouts, Regime Reversals, and Holdout Bias
No framework is free of failure modes, and the 200-week regime filter has several worth naming explicitly.
The first is false breakouts at the individual asset level. A single stock or sector ETF crossing above its 200-week SMA without confirmation from the broader market regime or sectoral peers is a weak signal. The 2021 to 2022 period in speculative technology and high-growth software is an instructive example. Many individual names crossed above their 200-week SMAs on momentum driven by zero interest rate conditions and pandemic-era demand pulls. Investors who treated that crossing as confirmation of a sustainable regime, without scrutinizing whether the underlying businesses had the free cash flow to support their valuations at any normalized discount rate, experienced sharp drawdowns when conditions changed in 2022.
The second pitfall is regime reversal lag. The 200-week SMA by design responds slowly. When a regime shifts from bull to bear, price can spend weeks or months below the moving average before the average itself begins to turn. Investors who are waiting for the moving average itself to roll over before adjusting their fundamental hurdle rates are responding to old information. The price location relative to the moving average is the real-time indicator. The direction of the moving average is confirmation, not the trigger.
The third pitfall is holdout bias: the tendency to maintain positions in assets that have crossed below their 200-week SMA because the fundamentals still look reasonable on a trailing basis. Trailing fundamentals are always the last thing to reflect a regime shift. Revenue recognition lags. Cost cuts can sustain operating margins for several quarters after underlying business momentum has broken. By the time trailing fundamentals deteriorate visibly, a regime-aware investor should already have reassessed their position sizing.
From Filter to Rebalancing Signal
The most durable practical application of the 200-week regime framework is not entry and exit timing. It is rebalancing discipline. This is where the framework most consistently adds value without requiring frequent action or generating the transaction costs that erode long-term returns.
At each scheduled rebalancing review, typically quarterly or semi-annually for a long-term portfolio, the 200-week status of each major position or asset class informs the direction of adjustments. Positions in risk-on regimes that have grown beyond target weight get trimmed back to target. Positions in risk-off regimes that meet the fundamental stabilization criteria get added to at the margin. Neither action requires a dramatic call about market direction. Both actions are consistent with basic portfolio hygiene.
The goal is not to predict when regimes will shift. The goal is to be less exposed when the cost of being wrong is highest, and more exposed when the evidence justifies it. The 200-week SMA, used as a filter rather than a trigger, is one of the most reliable tools available for making that judgment systematically.
Long-term passive investors who use broad index funds can apply this framework at the asset class level rather than the individual security level. When the S&P 500 or MSCI World index is trading well above its 200-week average and valuations are stretched, that is the environment to ensure your equity allocation has not drifted significantly above your target weight due to price appreciation alone. When those indices are trading below their long-term averages and fundamental conditions support recovery, that is the environment to ensure you are not underweight equities due to behavioral risk aversion at the worst possible time.
This is not market timing in the traditional sense. It is systematic, evidence-based portfolio maintenance informed by one of the most reliable long-cycle indicators available. That distinction matters both for investment outcomes and for the discipline required to execute the framework consistently across full market cycles.
Frequently Asked Questions
Q: Does using the 200-week SMA as a filter mean I am trying to time the market?
A: Not in the traditional sense. Market timing implies making binary in-or-out decisions based on short-term price predictions. Using the 200-week as a regime filter means adjusting the threshold of evidence you require before acting, and calibrating rebalancing decisions to the current risk environment. You remain invested throughout, but you apply different fundamental standards depending on which regime your assets are operating in.
Q: How do I determine the 200-week SMA for a specific stock or index?
A: Most charting platforms, including free ones such as TradingView, display the 200-week SMA when you switch the chart to weekly timeframe and add a simple moving average with a 200-period setting. For broad indices like the S&P 500, this data is widely available and updated in real time. The calculation is simply the arithmetic average of the closing price over the past 200 weekly closes.
Q: What if an asset has been below its 200-week SMA for several years? Does the framework still apply?
A: Yes, but with additional caution. Extended time below the 200-week SMA suggests either a structural bear market or a genuinely impaired business. In this scenario, the fundamental stabilization criteria described in this article become even more important. You need stronger evidence of business recovery and balance sheet durability before the regime location becomes a favorable rather than unfavorable factor. Historically, the deepest and most sustained below-average periods have preceded both the worst value traps and the best long-term buying opportunities. Fundamental discipline is what separates one from the other.
Q: Can this framework be applied to asset classes other than equities?
A: Yes. The regime-filter logic applies wherever price history is long enough to construct a meaningful 200-week average. Commodity markets, real estate investment trusts, and broad bond indices all exhibit recognizable long-cycle regimes that the 200-week SMA can help classify. The specific fundamental metrics you apply in each bucket will differ by asset class, but the core principle, tighter evidence requirements in permissive regimes, stabilization evidence required in adverse regimes, holds broadly across asset types.