№ 030 · Market Analysis · · 13 min
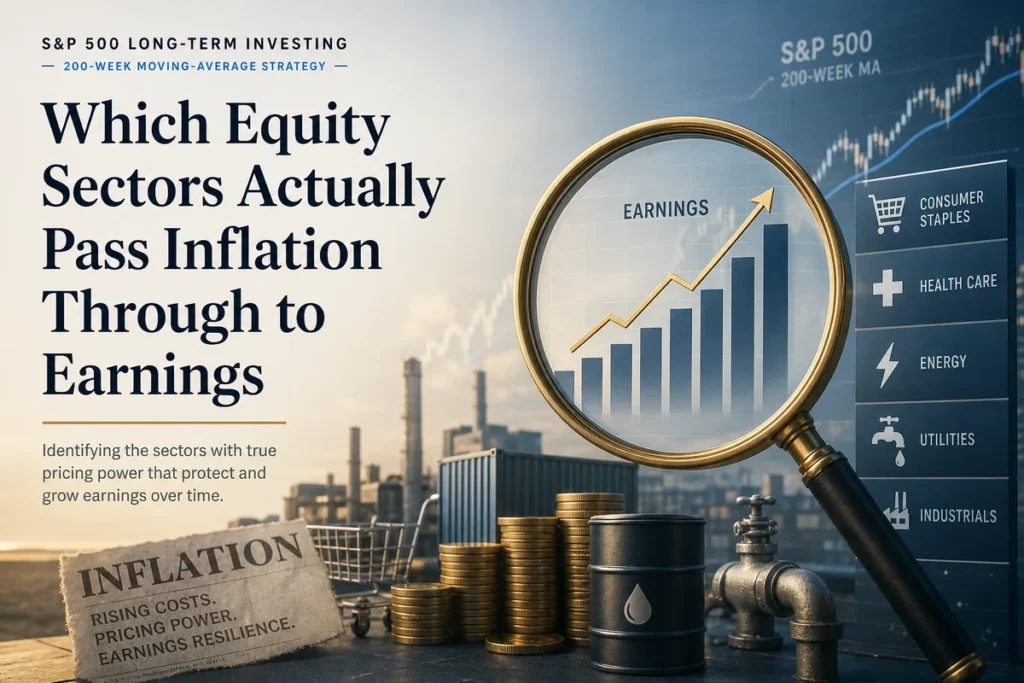
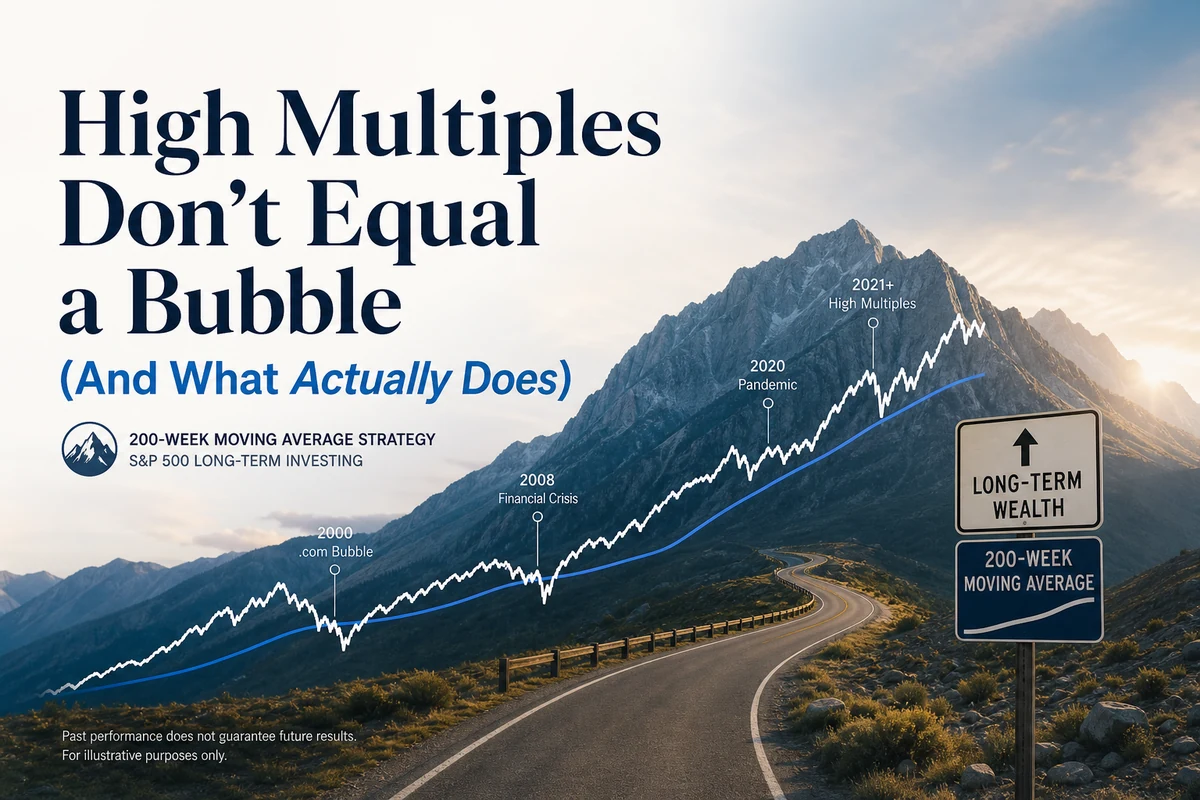
High Multiples Don’t Equal a Bubble (And What Actually Does)
A high P/E ratio makes markets expensive, not necessarily bubble territory. Learn the real markers — leverage, narrative dominance, and issuance frenzy — that separate overvaluation from speculative collapse.

Every time the S&P 500 trades at a trailing P/E above 25, a familiar chorus begins: this is a bubble. The argument is superficially intuitive. Prices are high relative to earnings, therefore something must be wrong, therefore a crash is coming. The problem is that this reasoning has led investors to sell out of perfectly rational bull markets, sit in cash through compounding years they can never recover, and develop a general paranoia about valuations that prevents them from thinking clearly about risk. High multiples are a meaningful signal, they genuinely predict lower future returns. But predicting lower returns is not the same thing as predicting a bubble. A bubble is a specific structural event with identifiable markers, and the P/E ratio is only a faint trace of one of them.
What a P/E Ratio Actually Tells You
The price-to-earnings ratio answers a single, precise question: how much are investors paying today for each dollar of current earnings? At a trailing P/E of around 28, roughly where the S&P 500 sits today as measured by the SPY ETF’s trailing multiple, investors are paying approximately $28 for every $1 of trailing twelve-month earnings. The historical average for the S&P 500 since the late 1920s has fluctuated, but a conventional mid-cycle range sits somewhere in the high teens to low twenties.
So a trailing P/E near 28 is elevated. It means future returns, starting from this price level, are likely to be lower than the long-run average of roughly 10% nominal annually. The Shiller CAPE, which smooths earnings over ten years to strip out single-year distortions, sat at 42.3 as of late May 2026, comparable to the peak of the technology bubble in 2000, when it reached approximately 44. History is unambiguous on what this means for the next decade of returns: they will probably be modest, and could be flat in real terms. That is the honest read of the data.
What the P/E ratio does not tell you is whether a crash is coming next year, next quarter, or next decade. The relationship between starting valuation and short-term returns is statistically negligible. Markets spent years in the mid-to-high twenties during the 1990s without collapsing, and they spent years in the high thirties before the actual peak in March 2000. The signal gets useful only over a ten-year horizon. Investors who sold because of stretched valuations in 1996 sat out four of the most profitable years in equity history before being validated, and even then, what finally broke the market was not the multiple itself.
Valuation tells you the price you are paying for the next decade of earnings growth. It does not tell you when Mr. Market will notice he has overpaid.
The Four Structural Markers of a Real Bubble
Historical bubbles share a recognizable anatomy. Looking across the dot-com collapse of 2000, the US housing crisis of 2007 to 2009, and the Japanese asset price bubble that peaked in 1989, four conditions appear repeatedly and in combination. None of them is the P/E ratio.
The first is narrative dominance: the widespread belief that a new paradigm has made old valuation frameworks obsolete. In 1999, the story was that the internet had changed the economics of business permanently, making earnings irrelevant compared to eyeballs and growth rates. In 2006 and 2007, the story was that real estate could not fall nationally, because it never had before. In Japan in the late 1980s, the belief was that Japanese corporate cross-holdings and land scarcity made valuations in Tokyo permanently higher than anywhere else on earth. In each case, the narrative was not entirely wrong, the internet did transform commerce, real estate does tend to hold value over time, but the extrapolation was extreme enough to make skeptics sound ignorant rather than prudent. When challenging the prevailing story makes you the fool in the room, that is a genuine warning signal. When an investment thesis requires no exit analysis because everyone knows the asset only goes up, you are close to the edge.
The second is leverage at scale. A bubble almost always requires borrowed money to reach its final, unsustainable height. Margin debt surged through record after record during the late 1990s and again into the 2007 peak. Japan’s banks funded speculative real estate and equity purchases throughout the late 1980s at ratios that had no plausible path to servicing if asset prices fell even modestly. The mechanism is straightforward: leverage amplifies gains on the way up, drawing in more participants, which drives prices higher, which makes the existing leverage look safe, which encourages more borrowing. The reversal is equally automatic. When prices fall, margin calls force selling, which drives prices lower, which triggers more calls. What starts as a correction becomes a cascade. According to data reported by Advisor Perspectives, NYSE margin debt rose 6.8% in April 2026 to a fresh record high, a figure worth monitoring, though margin debt at a record is not sufficient on its own to call a bubble. It is one instrument in a diagnostic panel, not a verdict.
The third is an issuance frenzy. In genuine speculative peaks, the supply of assets expands rapidly to meet demand. During the dot-com era, hundreds of companies with no earnings, no revenue, and sometimes no products completed IPOs at nine-figure valuations. In 2021, the SPAC boom served a similar structural function, with blank-check vehicles raising capital at valuations that would have struggled to pass traditional underwriting scrutiny a decade earlier. Research examining the performance of sector and thematic ETFs consistently shows the same pattern: excess returns in the three years before launch, near-zero returns after. Issuance chases past performance, not future fundamentals. A surge in IPO volume, particularly concentrated in a narrow theme or sector, is one of the cleaner leading indicators that a speculative cycle is maturing.
The fourth is the suppression of dissent. In a genuine bubble, skeptics are not merely wrong in the market’s view, they are socially and professionally isolated. Fund managers who refused to own technology stocks in 1998 and 1999 faced client redemptions. Analysts who questioned mortgage-backed securities valuations in 2006 faced institutional pressure. Benjamin Graham’s conception of Mr. Market is useful here: when Mr. Market is not merely optimistic but genuinely manic, when he will only accept offers and never question what he is paying, dissent has been priced out of the conversation. That is a structural condition, not just a sentiment reading.
Why the Dot-Com Crash Was Not Just About Multiples
The dot-com era illustrates why the four-condition framework matters more than any single valuation metric. The Shiller CAPE peaked near 44 in early 2000. Many analysts pointed to that number throughout 1998 and 1999 as evidence of a bubble. They were correct about the outcome but often wrong about the mechanism. The crash that followed was not a simple reversion of multiples to historical averages. It was the simultaneous unwinding of all four conditions.
Narrative dominance collapsed almost overnight when high-profile dot-com companies began reporting that their revenue projections had been fabricated or that their business models required indefinite subsidization from capital markets to survive. Leverage unwound through margin calls that accelerated the decline. IPO issuance had been running at a pace that was structurally impossible to sustain, and the pipeline froze entirely. The professional skeptics who had been sidelined throughout the late nineties found themselves suddenly vindicated and vocal. The S&P 500 fell 49% from peak to trough and took 384 weeks, roughly seven and a half years, to fully recover. The NASDAQ was considerably worse.
The key point is that multiples alone did not cause that outcome. Japan’s Nikkei traded at price-to-earnings ratios well above 50 at its 1989 peak, among the most extreme valuation readings of any major market in the modern era. But it was the combination of that extreme multiple with real estate leverage of staggering proportions, a banking system that had lent freely against inflated collateral, and a cultural narrative of invincibility that produced an index which, more than 35 years later, has only recently recovered its 1989 nominal high.
What Makes an Expensive Market Different From a Bubble
An expensive market is one where you are paying a premium for future earnings growth, and the question is whether that premium will be validated by actual earnings, compressed over time as rates normalize, or punished abruptly if growth disappoints. This is a return-dampening condition, not a structural collapse condition. The S&P 500 can deliver below-average returns for several years from a high-CAPE starting point without experiencing anything that looks like a historic crash.
Markets can remain expensive for extended periods while delivering positive, if below-average, annual returns. The investor who exited on valuation grounds alone often found that the remaining years of an overvalued bull market cost more in forgone compounding than the eventual correction returned in avoided losses. This is not an argument that high valuations are harmless. It is a precise argument about timing: valuation compresses returns over a decade, but it rarely specifies the calendar year of the correction.
The 2022 bear market illustrates this distinction sharply. That correction, which saw the S&P 500 fall 25% before bottoming, was triggered by a rapid repricing of risk-free rates as the Federal Reserve tightened aggressively. It was painful, but it recovered to new highs within 68 weeks. The mechanism was valuation compression from rising discount rates, not the structural collapse of a leveraged speculative system. There was no issuance frenzy to unwind, no paradigm narrative to shatter. It was an expensive market meeting a higher-rate environment and adjusting accordingly, a very different animal from the crashes that followed genuine bubble conditions.
A bubble requires borrowed money, a story that silences skeptics, and an issuance machine feeding the frenzy. High multiples are the kindling. The other three conditions are the fire.
Reading the Current Environment Honestly
The S&P 500 is near all-time highs, with the 200-week simple moving average sitting approximately 40% below the current price. That gap, as explored in the S&P 500’s 200-week SMA history, reflects the distance between current prices and the long-cycle support level that has historically defined major buying opportunities. The current CAPE of 42.3 places the market in the same valuation territory as the pre-2000 peak. The Buffett indicator, measuring total market cap relative to GDP, sits near 139%, above what Buffett described as playing with fire. The 10-year Treasury yield at 4.47% is creating genuine competition for equity capital in a way that was absent during the zero-rate era.
Applying the four-condition framework to the current environment gives a more textured read than any single number. The AI investment narrative carries genuine characteristics of narrative dominance: a widely held belief that the technology is transformative, that the companies building it command permanent premium valuations, and that skeptics are missing the point. Margin debt has reached fresh records. IPO and issuance activity, while not at late-1990s levels in breadth, has been concentrated in technology and AI-adjacent sectors. These are conditions worth monitoring carefully.
The suppression of dissent, however, remains incomplete. Value investors, international diversification advocates, and fixed income allocators all maintain visible institutional platforms and client flows. The skeptics are not yet professionally endangered for their views. That is a meaningful structural difference from the late 1990s, even if the valuation picture looks superficially similar. A more nuanced reading suggests the current market has one or two of the four conditions in partial form, rather than all four at full intensity.
The honest conclusion is that today’s market is expensive and the long-run return outlook from these levels is below average, consistent with what the Buy the 200 strategy and its emphasis on buying at long-cycle support levels is designed to address. But expensive and bubble are different risk categories requiring different responses. One calls for reduced return expectations and thoughtful position sizing. The other calls for structural caution about leverage and concentration in the narratively dominant theme.
How Long-Term Investors Should Use This Framework
The practical implication of separating valuation from bubble diagnosis is that it clarifies what to do and what not to do at different points in the cycle. From an elevated but not obviously bubble-like starting point, selling out of equities entirely based on valuation alone has historically cost more in missed compounding than it saved in avoided drawdowns. The evidence on this is strong enough to be stated plainly: trying to time an exit based on CAPE level is a losing strategy for most investors over most time periods.
What the bubble diagnostic framework enables is something more useful: a way of monitoring whether an expensive market is developing the structural conditions for a genuine collapse. When leverage is growing faster than asset values and that margin is funded by assets that cannot survive a price decline, that is worth acting on. When the IPO pipeline fills with companies that require the continuation of current speculative conditions to justify their valuations, that is worth noting. When professional skepticism about the dominant narrative becomes commercially toxic, that is a serious warning.
None of these conditions triggers an automatic sell. They call for reducing concentration in the narratively dominant segment, ensuring that leverage in the portfolio is minimal or zero, and maintaining international diversification rather than betting the entire portfolio on the single theme that Mr. Market finds most compelling. Dollar-cost averaging through volatile, expensive markets continues to build cost basis at whatever price the market offers, without requiring a prediction about when the narrative breaks.
The goal is not to be the investor who called the bubble correctly. It is to be the investor who understood the difference between an expensive market and a structurally fragile one, positioned accordingly, and did not miss the years of compounding that often precede the final act.
Surviving bubbles requires knowing when you are in one, not treating every expensive market as if it were one.
Frequently Asked Questions
Q: If a high P/E doesn’t mean a bubble, should I just ignore valuation entirely?
A: No. Valuation is one of the most reliable long-run return predictors available. Starting the next decade at a Shiller CAPE of 42 has historically meant below-average real returns over that horizon. The point is not to dismiss valuation but to use it correctly, as a return-shaping signal over ten-year periods, not as a crash trigger over the next twelve months.
Q: What was the single biggest difference between the 2022 correction and the 2000 crash?
A: Structure. The 2022 bear market was a repricing event driven by rising discount rates, the S&P 500 fell 25% and recovered within 68 weeks. The dot-com crash was a structural unwinding: 49% peak-to-trough, 384 weeks to full recovery, triggered by the simultaneous collapse of narrative, leverage, and an IPO frenzy that could not be sustained once capital markets closed to unprofitable companies.
Q: How do I watch for the conditions that actually precede a bubble collapse?
A: Track four things. First, whether the dominant investment narrative has become resistant to falsification, any earnings miss gets explained away as temporary. Second, whether margin debt and financial leverage are growing faster than the underlying asset values they are funding. Third, whether IPO or issuance volumes are concentrated in a single speculative theme. Fourth, whether institutional skeptics of the dominant theme face professional or commercial consequences for holding their views. The presence of all four conditions together is meaningfully different from any one in isolation.
Q: Does the 200-week SMA have anything to say about bubble risk?
A: The 200-week SMA reflects long-cycle trend, not bubble structure. When the S&P 500 trades roughly 40% above its 200-week moving average, as it does today, the distance from long-cycle support means that a genuine structural correction would be deep before that level became relevant as a floor. That context is worth holding alongside the valuation picture, the 200-week SMA explainer covers how that signal has historically behaved at major turning points.