№ 059 · Education · · 13 min
The Compounding Frequency Trap: Why More Trading Almost Always Hurts
Every trade resets a clock that was working in your favour. Here's the compounding math, tax drag, and behavioural costs that make frequent trading a wealth destroyer.

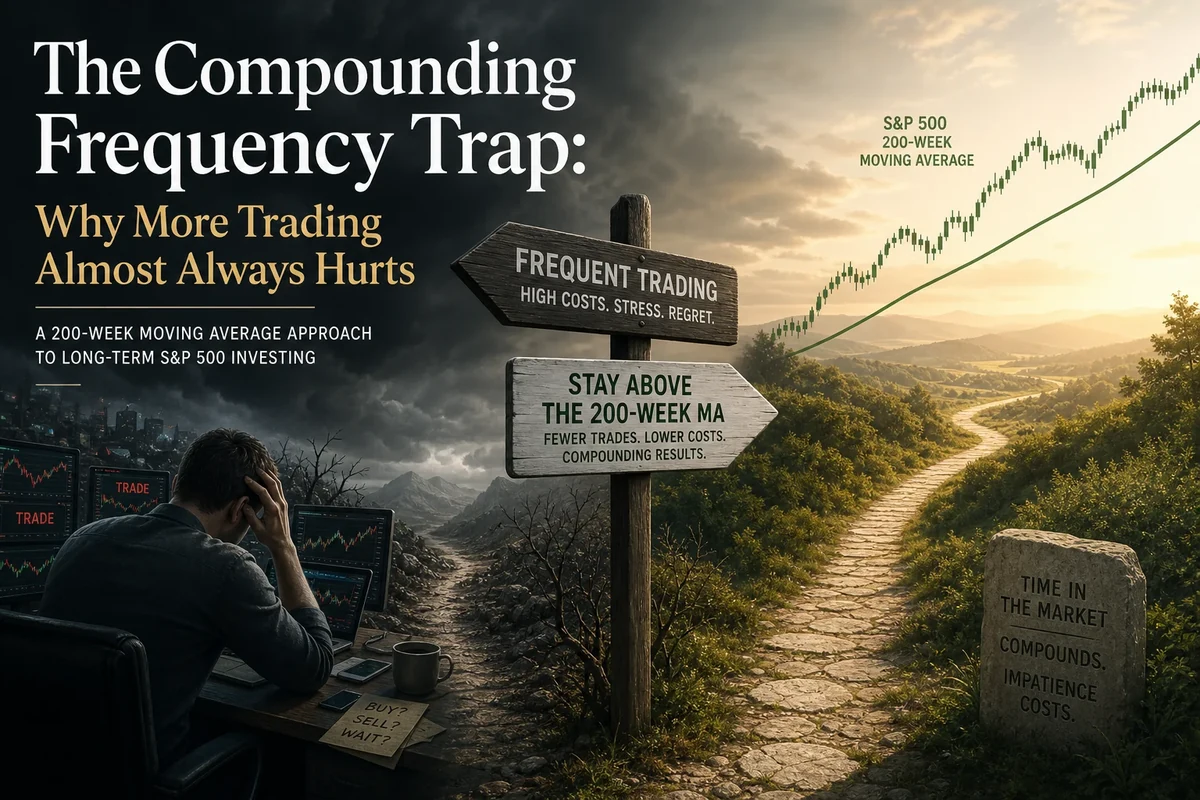
Every trade you make resets a clock that was working in your favour. The arithmetic of compounding is unforgiving in one specific way: the largest gains accumulate at the end of a holding period, not the beginning. An investor who sells, pays tax, and reinvests is not simply pausing the process. They are permanently handing a portion of their compounding base to the government and starting over at a smaller number. Do this repeatedly, and the gap between what you could have had and what you actually get becomes one of the most significant, and least discussed, performance drags in personal investing. Frequent trading is almost always self-defeating before you even consider whether the underlying stock picks are any good.
What Compounding Frequency Actually Means for Wealth
Compounding frequency, in portfolio terms rather than savings-account terms, refers to how often you liquidate and reinvest positions. A trader who turns over their portfolio twice a year is compounding at a very different rhythm from someone who holds for a decade. The difference is not stylistic, it is mathematical and structural.
The S&P 500 has delivered approximately 10% per year in nominal terms over the long run, and around 7% after inflation. At 10% annually, $100,000 doubles roughly every seven years. After 30 years, it grows to approximately $1.74 million. The critical feature of this sequence is that the gain in the final decade, from roughly $670,000 to $1.74 million, is larger in absolute dollar terms than the entire gain accumulated across the first two decades combined. Compounding is back-loaded. The longer you hold, the more of that back-loaded payoff you collect. Exit early, even once, and you never collect it in full.
The compounding that built generational wealth rarely happened in a single clever trade. It happened by refusing to undo what was already working.
This is the core of what we call the compounding frequency trap: the more often you trade, the more often you interrupt the back-loaded phase where most of the value is created. And the interruptions are not free.
The Three Layers of Friction That Erode Returns
Trading costs have fallen dramatically over the past two decades. Zero-commission brokerage accounts are now widespread, and bid-ask spreads on major index ETFs are nearly invisible for retail investors. This makes it tempting to assume that trading friction has been largely solved. It has not. A meaningful friction structure remains intact, and its most expensive layer is one that brokers never charge you explicitly.
The first layer is transaction costs. Even at zero commissions, every trade carries an implicit cost in the bid-ask spread, the difference between what a buyer pays and what a seller receives. For large-cap stocks and the most liquid ETFs, this might be a basis point or two per trade. For smaller positions in less liquid securities, it can be meaningfully larger. Research simulating trend-following strategies with realistic turnover has estimated transaction drag in the range of 0.09% per year under today’s favourable conditions, a figure that rises when trade frequency increases or position sizes drop.
The second layer is tax drag on realized gains. In a taxable account, every sale of an appreciated position triggers a capital gains liability. At short-term rates in the United States, those gains are taxed as ordinary income, potentially above 37% at the federal level for high earners. Long-term gains, for positions held more than a year, face lower rates, typically 15% or 20% plus applicable state taxes, but still represent a permanent reduction in the compounding base. Every dollar of tax paid is a dollar that is no longer earning future returns. A position that has grown from $100,000 to $200,000 over five years, sold and reinvested, starts the next cycle at $170,000 or less rather than $200,000. That $30,000 difference compounds for the remaining decades at whatever the market returns, and the shortfall widens every year.
The third layer is the opportunity cost of behavioural errors, which tend to multiply with trading frequency. The more decisions you make, the more chances you have to make a poor one: selling near a bottom, re-entering after a recovery, rotating into the prior year’s winner at peak valuation. These errors are not random. Research in behavioural finance consistently shows that retail investors systematically buy after strong performance and sell after poor performance, meaning the average investor in a given fund earns meaningfully less than the fund itself returns over the same period. Frequent trading amplifies this pattern considerably.
What Barber and Odean Actually Found
The most cited academic evidence on this question comes from Brad Barber and Terrance Odean’s 2000 study, “Trading Is Hazardous to Your Wealth,” published in the Journal of Finance (Vol. 55, pp. 773, 806). Analysing the brokerage records of tens of thousands of individual investors, they found that households holding common stocks pay a substantial performance penalty for trading actively. The investors who traded most frequently earned net annualized returns significantly below both the market and the returns of their lower-turnover peers. Odean’s related 1999 work established the directional problem clearly: the stocks investors sell tend to outperform the stocks they buy over the subsequent year. The act of trading itself, not just the cost of trading, destroys value.
This finding is counterintuitive in the way that most durable investing truths are. People trade because they believe they have an insight that justifies the switch. The evidence says that on average they do not, and the assumption of superior insight combined with the mechanical headwind of taxes and spreads produces a predictably bad outcome. The investors who traded least in the Barber-Odean sample were, net of costs, the best performers among individual investors. Their advantage had nothing to do with stock-picking skill. It came almost entirely from not getting in their own way.
Odean’s 1999 finding deserves to be read slowly: the stocks individual investors sold outperformed the stocks they bought in the following year. Trading destroyed value twice, by selling something that continued to rise, and by buying something that did not.
The Tax Deferral Advantage Is Larger Than It Looks
Tax-deferred compounding is one of the few genuine structural advantages available to long-term investors, yet it is consistently undervalued because the benefit is invisible until calculated explicitly. The table below illustrates the compounding gap using a 10% gross annual return, a 25% capital gains tax rate, and two different turnover strategies over 30 years. All figures are illustrative, derived from standard compound interest calculations using verified long-run S&P 500 return data.
| Strategy | Gross balance at 30 years | Tax events | Estimated after-tax balance |
|---|---|---|---|
| Buy-and-hold (one exit at year 30) | ~$1,745,000 | 1 | ~$1,359,000 |
| Five-year turnover cycle (6 exits) | ~$1,270,000 | 6 | ~$1,020,000 |
| Difference in after-tax terminal wealth | ~$339,000 |
The buy-and-hold investor also holds one important advantage the table above does not fully capture: the ability to time the final sale strategically, in a low-income year, in retirement, or through estate planning mechanisms that further reduce the effective rate. The churning investor gets none of this flexibility, because each five-year cycle creates its own tax event regardless of circumstances at that moment. Research on concentrated gains has noted that large realizations concentrated into a single tax year can push investors into higher ordinary income brackets or trigger phase-outs on other benefits, compounding the damage beyond the headline rate.
Why Active Funds Carry the Same Structural Problem
The compounding frequency trap is not only a problem for individuals making their own trading decisions. It is embedded in the structure of any high-turnover investment vehicle, including most actively managed mutual funds.
Index funds passively replicating the S&P 500 or MSCI World typically carry expense ratios as low as 0.03% to 0.04% annually (as of September 2026), trading very rarely since they only adjust when the index itself changes. Actively managed funds, which must justify their fees by appearing to be doing something, have historically charged from around 0.44% to well above 1.00% depending on the strategy and distribution channel. But the expense ratio is only part of the story. Active funds also generate taxable capital gain distributions when their trading triggers realized gains inside the fund, passing the tax event to all shareholders regardless of whether those shareholders ever sold a single unit. An index fund investor in a taxable account, particularly one using the ETF structure with its in-kind redemption mechanism, largely escapes this problem entirely. The turnover frequency difference between a passive index fund and an average active fund is the same friction problem operating at the fund level rather than the individual level.
You can read a more detailed breakdown of how wrapper choice affects this tax efficiency in this analysis of index funds versus ETFs, which covers the capital gain distribution mechanics in full.
The Behavioural Multiplier: Frequency Makes Everything Worse
There is a subtler problem with high trading frequency that sits beneath the math of taxes and spreads. Trading frequently forces more decisions, and more decisions create more surface area for behavioural error.
An investor who holds a diversified index fund and checks the price twice a year has almost no opportunity to make a catastrophic decision. The bear markets will come, valuations will spike or contract, the headlines will be alarming, but none of these events require action from someone who has committed to a long cycle. The 200-week simple moving average, which has historically marked major long-cycle support levels for the S&P 500, is specifically useful here as a filter for separating genuine secular shifts from short-cycle noise. Investors anchored to a long-cycle framework of this kind are structurally less likely to react to volatility in ways that destroy value.
The investor making dozens of trades a year, by contrast, is repeatedly exposed to the full weight of loss aversion, overconfidence, recency bias, and the disposition effect, that well-documented tendency to sell winners too early and hold losers too long. Each of these biases produces a return drag that compounds alongside, and against, the portfolio’s market exposure. Behavioural finance research has documented that the disposition effect causes investors to sell their best positions while retaining their worst, which is precisely the opposite of what compounding requires: holding the things that are working long enough to let the back-loaded gains accumulate.
The pattern Barber and Odean identified, where active traders systematically buy the wrong thing after selling the right thing, reflects the behavioural multiplier in its clearest form. Frequency does not give investors more chances to be right. It gives them more chances to be wrong, with consequences that compound over time.
What Low-Frequency Investing Actually Looks Like in Practice
Low-frequency investing is not synonymous with never rebalancing or ignoring structural changes in a portfolio. It means that the default position is inaction, and that action is reserved for situations where the case for change is overwhelming rather than merely interesting.
A practical framework treats the initial asset allocation decision as the high-value work, executed once with genuine care, and then defends it with minimal interference thereafter. Adding new savings regularly, rebalancing when allocations drift meaningfully from targets, and reviewing the overall structure every few years is entirely compatible with a low-turnover posture. What is incompatible is the habit of rotating between sectors in response to macro narratives, switching funds because last year’s winner looks attractive, or selling positions after a drawdown because the discomfort has become intolerable.
The S&P 500’s long-run nominal return of approximately 10% per year compounds powerfully over decades precisely because it does not require active management to achieve. A single purchase of a broad market index fund held through multiple full market cycles, including bear markets that felt genuinely alarming at the time, has historically produced outcomes that active rotation strategies rarely match after all frictions are accounted for. As of September 2026, the Shiller CAPE ratio sits at approximately 41.6x, elevated relative to its long-run average of around 16 to 17x. The appropriate response for a long-cycle investor is rarely to trade more. It is to be more patient about entry points and more disciplined about not disturbing positions that are already working, while keeping perspective on the fact that high valuations predict lower long-run returns without reliably predicting short-run declines.
The real intellectual work in long-term investing belongs in asset allocation and entry discipline, not in timing exits and chasing rotations. More trading almost never substitutes for better thinking at the front end.
The compounding frequency trap is ultimately a trap of action bias. The market rewards investors who can sustain a position through volatility, collect the back-loaded gains that only appear after many years, and avoid handing their compounding base to the tax authority more often than necessary. None of this requires finding the next great stock. It requires, more than anything, the discipline to do less than feels right at any given moment.
Frequently Asked Questions
Q: Does the compounding frequency trap apply inside a tax-sheltered account like an IRA or ISA?
A: Partially. Inside a tax-sheltered wrapper, the capital gains tax layer disappears entirely, which removes the largest single friction from frequent trading. Transaction costs and behavioural errors still apply, and the opportunity cost of poor rotation decisions does not disappear simply because no tax is owed. Long-horizon holding in a tax-sheltered account remains preferable to frequent trading, but the penalty for turnover is materially lower than in a taxable account.
Q: How much does tax drag actually cost over a long holding period?
A: The magnitude depends on the return rate, the tax rate, and how frequently gains are realized. The illustrative table in this article, using a 10% gross annual return over 30 years with a 25% tax rate applied at each five-year turnover versus deferred to the end, shows a terminal wealth gap of roughly $339,000 on a $100,000 starting investment. The longer the holding period and the higher the underlying return, the larger the absolute dollar value of the tax deferred. The directional conclusion, that deferral is worth a great deal, is robust across a wide range of plausible assumptions.
Q: If I believe a stock or fund is genuinely overvalued, should I still hold?
A: Valuation is a legitimate input, but it has a poor track record as a short-term timing tool. The Shiller CAPE ratio has shown reasonable accuracy in predicting long-run ten-year returns while being nearly useless for predicting what markets will do in the next twelve months. Selling a position because it looks expensive means bearing a certain tax cost now in exchange for avoiding an uncertain loss later, a trade that only makes sense if the overvaluation is extreme and the reinvestment opportunity is clearly superior. For most investors in most situations, the bias should strongly favour holding.
Q: What is the research basis for the claim that frequent traders underperform?
A: The most rigorous evidence comes from Barber and Odean’s “Trading Is Hazardous to Your Wealth,” published in the Journal of Finance in 2000 (Vol. 55, pp. 773, 806). Analysing the actual brokerage records of tens of thousands of individual US investors over a multi-year period, they found that the highest-turnover investors earned net annual returns significantly below the market, while the lowest-turnover investors came closest to capturing the market’s full return. The gap was explained by the costs of trading itself and the systematic tendency to sell the wrong things at the wrong time.