№ 007 · Market Analysis · · 12 min
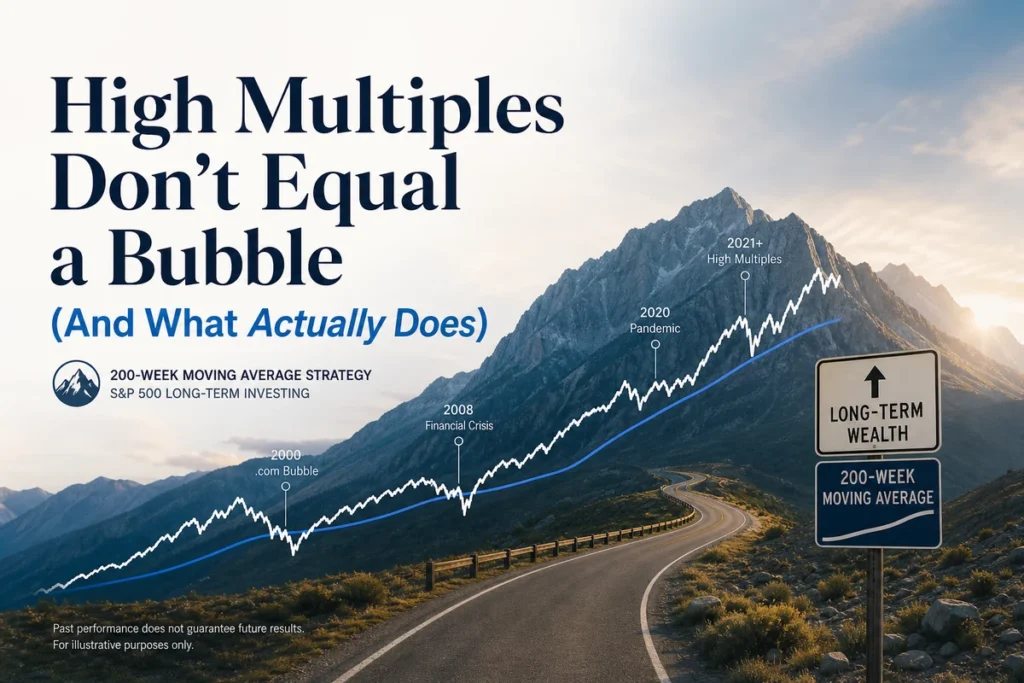
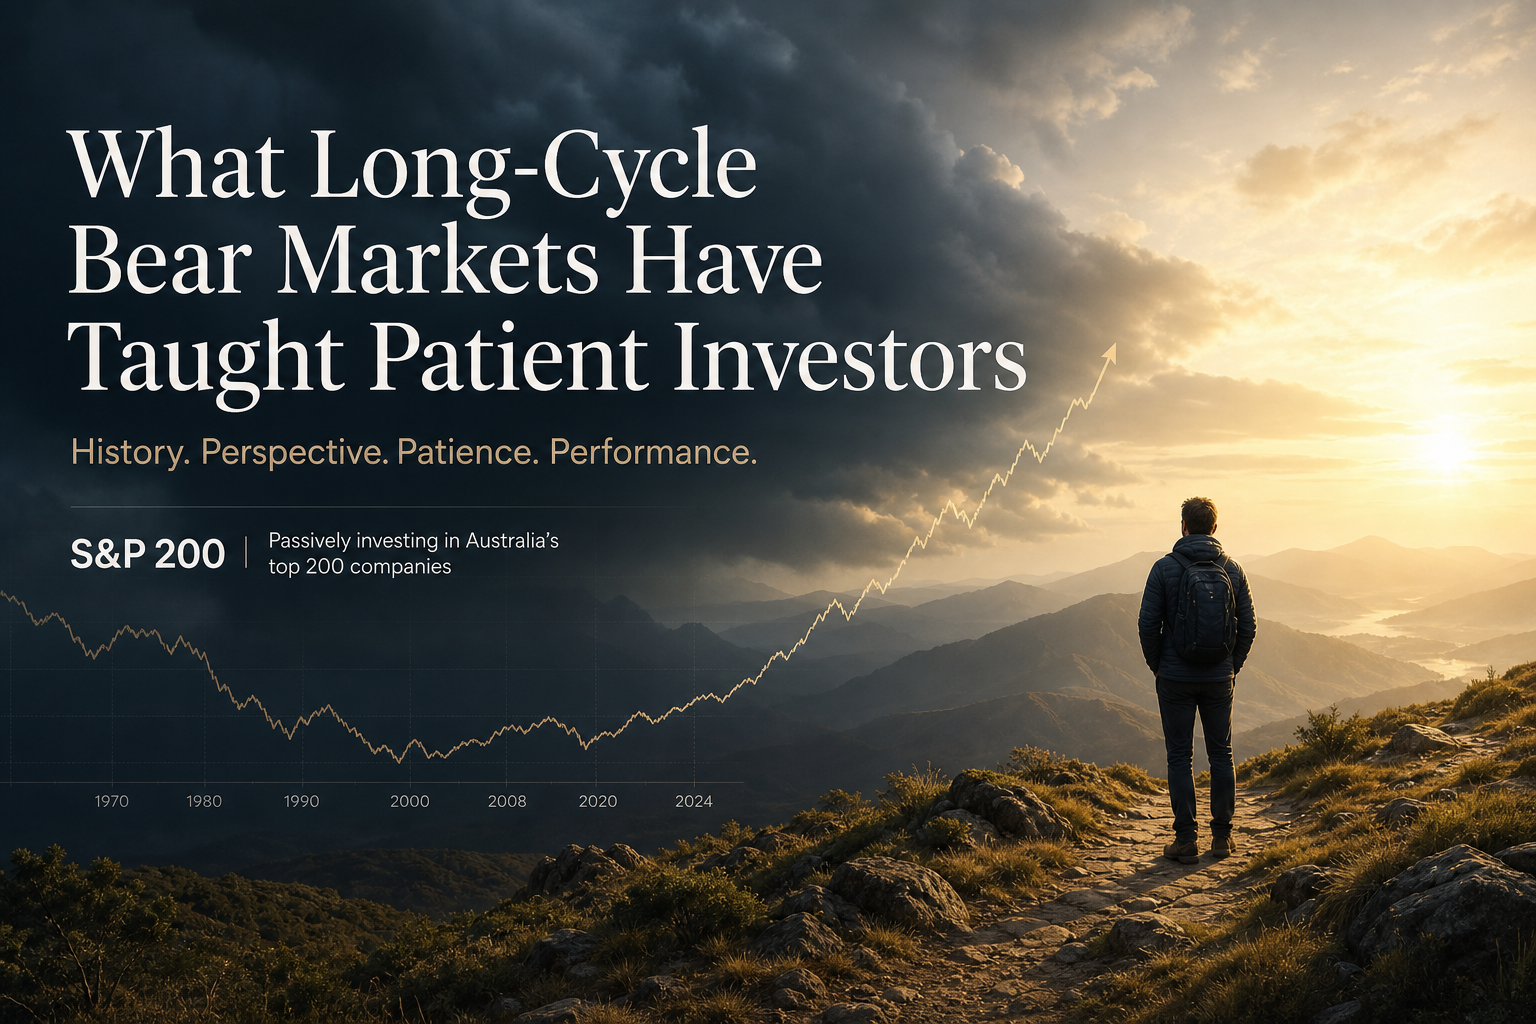
What Long-Cycle Bear Markets Have Taught Patient Investors
The 1966-1982 secular bear, the 2000-2009 lost decade, and Japan's post-1989 collapse each lasted long enough to break most strategies. Here is what actually worked, and why the lessons still matter.

Most investors mentally prepare for a bear market that lasts a year or two. They rehearse the script: prices fall, sentiment collapses, headlines scream, and then the recovery begins. That is the cyclical bear market, and it is uncomfortable but survivable with a straightforward buy-and-hold approach. The secular bear market is something different. It can run for a decade or more, repeatedly producing rallies that feel like recoveries but are not, and it tests a patience that most people simply do not possess. Three episodes in modern financial history define what secular bear markets actually look like: the United States from 1966 to 1982, the global equity collapse from 2000 to 2009, and Japan from 1989 onward. Each case offers specific and sobering lessons about what works, what does not, and why the architecture of a long-term portfolio matters more than any short-term call.
The 1966 to 1982 Bear: Inflation Ate the Returns
The S&P 500’s nominal price level in August 1982 was roughly where it had been in early 1966. In between, there were dramatic rallies, false dawns, and moments when investors genuinely believed the worst was over. In real, inflation-adjusted terms, the losses were far worse. Consumer price inflation averaged over 6% annually through much of the 1970s, meaning that a portfolio that merely kept pace with the index lost purchasing power steadily year after year. The investor who held a simple S&P 500 index fund through the entire period and did nothing else ended 16 years with, at best, flat nominal wealth and substantially diminished real wealth.
What worked during this period was not cleverness in stock selection. It was the combination of assets that behaved differently from equities under inflationary conditions. Commodities, real assets, Treasury Inflation-Protected structures, and international equities with different inflation dynamics all provided genuine diversification when domestic large-cap equities could not. Investors who held some allocation to hard assets, particularly energy and resource-related equities, preserved real wealth. Those who remained concentrated in US large-cap growth stocks did not.
Dollar-cost averaging during this era produced a counterintuitive outcome worth examining carefully. An investor who contributed a fixed amount monthly from 1966 through 1982 accumulated shares at progressively lower and then higher prices. When the great bull market began in August 1982, that investor held a large number of shares purchased at depressed prices. The subsequent recovery from 1982 through 1999 was one of the most powerful in recorded market history, and those who had kept buying through the dark years received an outsized benefit. This is not a guarantee. It is a structural advantage that systematic investing creates under conditions that feel punishing at the time.
The 2000 to 2009 Lost Decade: Concentration Compounded the Damage
The lost decade for US equities began with the collapse of the technology bubble in 2000 and ended with the S&P 500 trading below its March 2000 peak following the 2008-2009 financial crisis. Over the full ten-year period, the S&P 500 produced a negative total return in nominal terms, a genuinely rare outcome for a decade-long holding period in US equity history. The psychological damage was severe because investors experienced two distinct crashes separated by a partial recovery. The dot-com collapse from 2000 to 2002 wiped out roughly half of the index’s value. The financial crisis from late 2007 to early 2009 nearly matched that destruction.
The lost decade did not punish investors equally. It punished concentration. Those who held globally diversified portfolios across asset classes experienced a meaningfully different outcome than those who held US large-cap equities alone.
Emerging market equities, as measured by the MSCI Emerging Markets Index, delivered strongly positive returns over the 2000-2009 period. International developed market equities, represented by the MSCI EAFE Index, also outperformed US equities over the full decade, though with significant volatility. Real estate investment trusts in the US performed well through most of the decade before collapsing in 2008. Commodities, particularly energy, had a strong run through 2008. A truly diversified portfolio that maintained exposure across geographies and asset classes did not experience the lost decade in the way that a US-only equity portfolio did.
The lesson here is not that investors should time these allocations. It is that structural diversification, maintained through rebalancing, naturally shifted weight toward what was working and away from what was not. The investor who rebalanced annually during the lost decade was selling overperforming assets and buying depressed US equities throughout, which set them up for the powerful 2009-2019 recovery that followed. Rebalancing is not a way to avoid secular bear markets. It is a mechanism for surviving them and eventually benefiting from the recovery.
Japan After 1989: The Warning That No Market Is Immune
Japan’s Nikkei 225 reached an all-time high of approximately 38,915 in December 1989. It would not approach that level again for over three decades. The decline was not a brief crash followed by recovery. It was a grinding, decades-long deterioration punctuated by powerful bear market rallies that repeatedly attracted optimistic investors before failing again. By early 2009, the Nikkei had fallen roughly 80% from its peak. Even after the partial recovery driven by Bank of Japan policy and the “Abenomics” era, Japanese equities remained below their 1989 peak in nominal terms for more than 30 years.
Japan is the clearest historical case against the assumption that any major developed-market equity index must eventually recover and reward patient holders within an investor’s time horizon. This is not a minor caveat. It is a structural warning about the risk of home-country bias and single-market concentration. An investor who placed their entire retirement savings in Japanese equities in 1989 and planned to retire in 2009 faced a catastrophic outcome regardless of their patience or investment discipline.
What would have helped a Japanese investor? International diversification, first and above everything else. A portfolio that allocated meaningfully to US equities, European equities, and emerging markets through index funds would have captured the strong global bull markets of the 1990s and the 2010s, substantially offsetting the domestic stagnation. Additionally, fixed income allocation would have provided return and stability during the equity collapse, since Japanese government bonds produced positive returns through much of the period. The Japan case is one reason why serious long-term investors treat global diversification not as a tactical overlay but as a structural requirement.
What Actually Worked Across All Three Episodes
Pulling the common threads across three very different secular bear markets produces a clear picture. Geographic diversification was the single most consistent protective factor. In every case, global equity exposure cushioned the blow of the home-market decline, whether that market was the inflation-ravaged US of the 1970s, the overvalued US tech sector of 2000, or the bubble-era Japanese market of 1989. Investors who were structurally committed to owning the world, not just one market, fared better.
Asset class diversification was the second consistent factor. Pure equity portfolios, particularly those concentrated in a single sector or market, suffered the most. Portfolios that included fixed income, real assets, and international equities in balanced proportions were more resilient. This is not simply a function of lower volatility. In inflationary secular bears like 1966-1982, bonds in isolation also struggled. The point is that no single asset class dominates across all economic regimes, which is the foundational argument for multi-asset diversification that does not change based on current conditions.
Dollar-cost averaging demonstrated its value as a behavioral and mechanical tool. Investors who kept contributing through secular declines built larger share counts at lower prices, a structural advantage that paid off in the eventual recovery. The critical requirement was that they did not stop contributing when the environment felt hopeless, which is precisely when the averaging benefit was largest. This requires either strong discipline or automated contribution structures that remove the decision from human emotion.
The investors who recovered fastest from secular bear markets were not those who timed the bottom. They were those who kept contributing, stayed diversified, and rebalanced systematically when everyone around them had given up.
What Did Not Work
Several strategies that seem intuitively reasonable in secular bear markets consistently failed. Rotating into the previous cycle’s winners rarely worked because secular bears typically begin after extended periods of concentration in a particular sector or market, and those leaders often led the decline. Technology stocks were the leaders of the 1990s bull and the leaders of the 2000-2002 collapse. Japanese financial and real estate stocks led the 1980s bull and were destroyed in the subsequent crash.
Market timing based on valuation alone also consistently underperformed as a strategy during secular bears. Valuations can remain stretched for years before collapsing, and they can remain compressed for years after collapsing. An investor who sold in 1997 because US equity valuations looked extreme missed two additional years of strong returns, and an investor who bought Japanese equities in 1992 because they looked cheap relative to 1989 watched them continue to fall for years. Valuation is useful for setting long-term return expectations. It is unreliable as a timing mechanism.
Abandoning equities entirely at the first sign of a secular bear, or after the first major leg down, was also consistently damaging. The 1970s produced multiple powerful bear market rallies, including gains of 50% or more from trough to subsequent peak, before the secular bear resumed. Investors who sold during the initial decline and waited for clarity often missed these rallies, then re-entered at higher prices just before the next leg down. The pattern repeated in Japan and in the 2000s. Secular bears are designed, in a structural sense, to force investors out at the worst possible times.
The 200-Week SMA as a Long-Cycle Compass
Technical signals rarely add value in the context of individual stocks or short-term market moves, but the 200-week simple moving average has a coherent role in identifying long-cycle regime shifts. During each of the secular bear periods examined here, prolonged trading below the 200-week SMA coincided with the deep structural phases of the decline. The signal is not a sell trigger or a market-timing tool in the traditional sense. It is a regime indicator, a way of distinguishing whether an investor is navigating a cyclical correction within a secular bull or a structural shift into a secular bear.
Used properly, the 200-week SMA functions as a prompt for allocation review rather than a trading signal. An investor who noticed that the S&P 500 had sustained a break below its 200-week SMA in 2001 or 2008 had useful evidence that the environment warranted a defensive tilt in new contributions, a rebalancing toward fixed income, or at minimum a reconsideration of leverage and concentration. None of that requires market timing in the damaging sense. It simply means that a long-cycle indicator was consistent with what fundamentals, valuations, and economic conditions were already suggesting.
The 200-week SMA is most valuable when it confirms other evidence rather than when it contradicts it. In early 2009, as the S&P 500 was deeply below its 200-week average, valuations by most measures were reasonable to cheap, credit markets were beginning to stabilize, and the Federal Reserve was aggressively easing. The confluence of signals argued for maintaining equity exposure and continuing to invest, even though the technical picture alone looked bleak. That kind of multi-factor assessment, combining long-cycle technical context with fundamental and macroeconomic evidence, is how serious long-term investors actually use these tools.
Building a Portfolio That Can Survive the Long Cycle
The practical implication of these three case studies is that portfolio construction needs to account for the possibility of a decade-long period of negative or flat real returns in any single market. This is not pessimism. It is risk management. A portfolio that can only succeed if the home market delivers steady positive returns every decade is not a robust portfolio.
Global diversification through low-cost index funds tracking the MSCI World or MSCI All Country World Index provides genuine exposure to multiple markets and economic regimes simultaneously. When one region enters a secular bear, others are often in different phases of the long cycle. Systematic rebalancing maintains target allocations and forces the buy-low discipline that most investors fail to maintain emotionally. Fixed income allocation provides ballast, income, and dry powder for rebalancing into equity declines. And regular contributions, whether monthly or quarterly, maintain the dollar-cost averaging benefit through whatever conditions prevail.
No portfolio strategy eliminates the possibility of a secular bear market. The goal is to build a structure that survives one, keeps accumulating through it, and positions the investor to capture the eventual recovery fully.
Long-cycle bear markets are not anomalies. They are a recurring feature of financial history, and they will occur again. The investors who navigate them successfully are not those with superior forecasting ability. They are those with superior preparation: diversified across markets and asset classes, systematic in their contributions and rebalancing, and clear about the difference between what they can control, their costs, their behavior, and their allocation, and what they cannot, which is the timing and depth of any given secular decline.
Frequently Asked Questions
Q: How long do secular bear markets typically last?
A: Historically, secular bear markets in major developed markets have lasted anywhere from roughly a decade to multiple decades. The US 1966-1982 period ran about 16 years in nominal terms. The 2000-2009 lost decade was roughly ten years. Japan’s post-1989 stagnation in nominal terms extended beyond 30 years. There is no fixed duration, which is precisely why strategies that require a specific timeline for recovery are fragile.
Q: Does dollar-cost averaging actually help during a secular bear market?
A: It depends on the time horizon. Within the secular bear period itself, dollar-cost averaging does not prevent losses and does not guarantee positive nominal returns. What it does is systematically lower the average cost basis, accumulate more shares at depressed prices, and position the investor for stronger recovery returns when the secular trend eventually reverses. The historical evidence from the 1966-1982 and 2000-2009 periods supports this outcome for investors who maintained contributions throughout.
Q: Is Japan a realistic worst-case scenario for other developed markets?
A: Japan’s post-1989 experience reflects a confluence of factors that were unusually severe: extreme starting valuations, a simultaneous real estate collapse, demographic headwinds, and monetary policy that was slow to respond. Not every developed market faces that combination. However, the lesson is not that Japan is uniquely cursed. It is that no major market is structurally immune to multi-decade stagnation, which is the clearest argument for global rather than home-country-concentrated equity exposure.
Q: Should an investor use the 200-week SMA as a sell signal during a secular bear?
A: Not as a binary sell signal, no. The 200-week SMA is most useful as a regime indicator that prompts a review of allocation and risk exposure rather than an instruction to move to cash. Investors who sold entirely when prices broke the 200-week SMA during past secular bears often missed the powerful bear market rallies that occurred within those secular declines, and many failed to re-enter at lower prices. The signal is best used as one input among several, combined with valuation assessment, economic context, and a clear understanding of the investor’s own time horizon and contribution capacity.