№ 068 · Education · · 12 min
Checking Your Portfolio Too Often Is a Statistical Tax
See why daily portfolio checks turn normal noise into pain, and which simple automation habits keep your long-term returns safe from your own reactions.

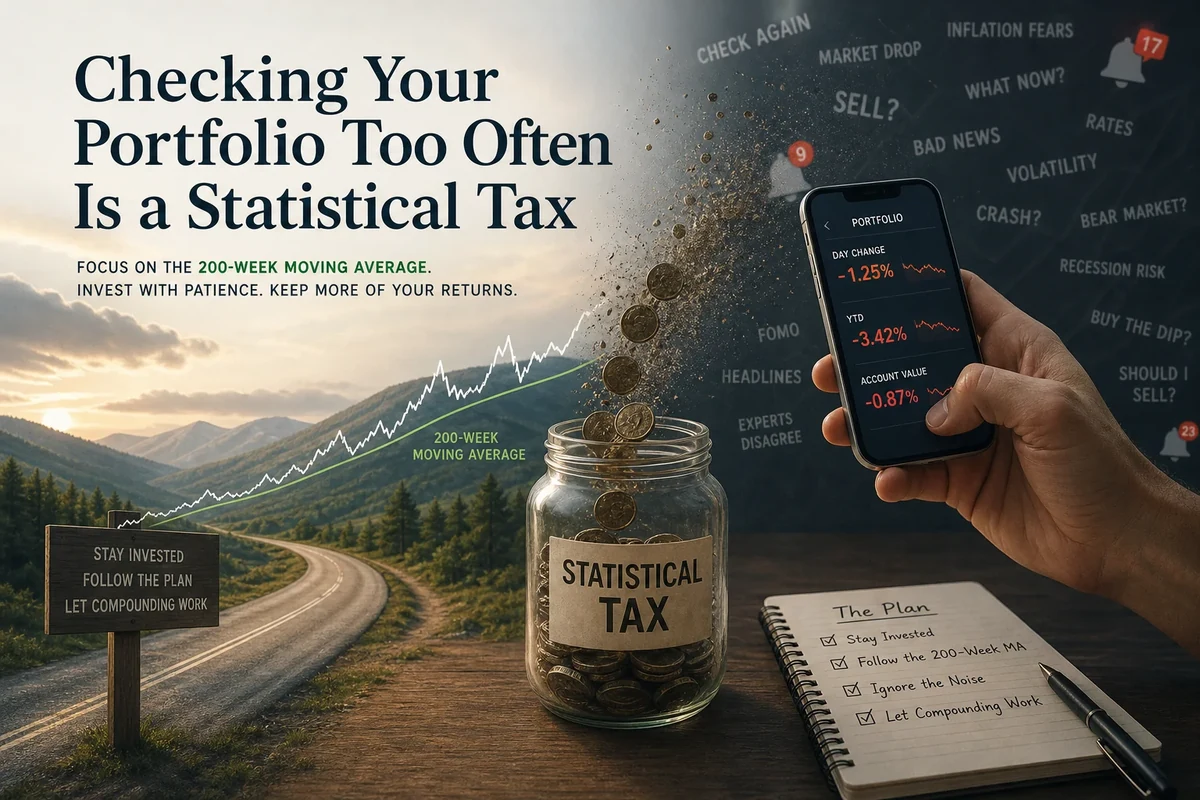
Checking a diversified portfolio every day exposes you to a loss on a little under half of all trading days, while checking once a year exposes you to a down year far less often. The investment is identical in both cases. Because losses are felt about twice as strongly as equivalent gains, frequent checking turns ordinary market noise into a steady stream of psychological penalties, and those penalties push people toward selling, hesitating, or tinkering at the worst possible moments. The practical answer is to look rarely, automate contributions and rebalancing, and tie any review to a calendar instead of a headline. The sections below show the arithmetic, explain the mechanism, and set out specific habits. The figures come from verified S&P 500 drawdown history, a live reading of the index and its 200-week moving average, and a stylised model whose arithmetic I checked by hand.
How Often Should a Long-Term Investor Check a Portfolio?
An investor in the accumulation phase who holds a broad index fund gains almost nothing from checking more than once a quarter, and once or twice a year is defensible. The decisions that drive outcomes are the savings rate, the asset allocation, and the occasional rebalance, and none of them needs revisiting because of Tuesday’s close. Retirees who draw income have a legitimate reason to review cash reserves more often, and they can do that without looking at prices.
The reason is informational. A price quote only helps if it changes what you will do, and for a diversified holder with a multi-decade horizon, almost no daily quote should change anything. Each look therefore delivers emotional cost with no offsetting decision value. That is the sense in which the habit works as a tax. It is levied on every observation, and it gets paid in anxiety, attention, and eventually in poor trades.
The Arithmetic of Red Days
The S&P 500 closes higher on a little over half of all trading days, so a daily observer sees a green number slightly more often than a red one, and still meets more than a hundred red days in every trading year. Over a multi-decade saving career, that adds up to thousands of small losses, each one landing relative to yesterday’s reference point.
Stretch the window and the picture changes sharply. A clear majority of calendar years have been positive for the index since the 1920s. Over rolling 20-year windows with dividends reinvested, the index has historically delivered gains in nominal terms, although inflation-adjusted returns in the weakest windows were thin. The same asset, the same dividends, and the same companies produce a very different emotional record depending only on the interval you choose to look at.
A simple stylised model shows why. Assume a long-run return of about 10% a year, matching the S&P 500’s long-run nominal compound rate, and an annual volatility of about 16%, a round figure assumed for illustration. The expected gain on one trading day is then about 0.04%, against a typical daily swing near 1%, so the signal is about one twenty-fifth the size of the noise. Over one year the expected gain is 10% against a typical swing of 16%, and the ratio improves to about 0.6. Over 20 years, expected growth accumulates in proportion to time while the noise grows only with the square root of time, which lifts the ratio to about 2.8. Converted into the chance of a positive outcome, the model implies roughly 52% for a day, 73% for a year, and better than 99% for 20 years. Those outputs sit comfortably with the broad pattern in the historical record.
In a stylised model of the index, daily observation samples a process where noise outweighs signal by roughly 25 to 1, and observation over decades reverses that ratio. The asset is unchanged, and only the sampling interval differs.
Every extra observation is a draw from the noisy end of that distribution. The long-run expectation does not improve because you drew more often, yet each draw gives your loss-averse brain another chance to register a hit.
Why Does Frequent Checking Make Losses Feel Worse?
Losses hurt more than gains please, and frequent checking multiplies the number of times that asymmetry gets triggered. Kahneman and Tversky’s 1992 work on cumulative prospect theory put the median loss aversion coefficient at about 2.25, meaning a loss registers as roughly 2.25 times as painful as an equal gain registers as pleasant. A 1% down day therefore feels as bad as a 2.25% up day feels good.
That coefficient lets you compute how often a bet must win before it feels acceptable. For a symmetric wager, with equal sizes of win and loss, the break-even probability is 2.25 divided by 3.25, or about 69%. A daily outcome that is up only a little more than half the time falls well short of that threshold, so each day registers as a net negative experience even though the expected return is positive. An annual outcome that is up about 73% of the time in the model clears it. Actual returns differ in size between up and down periods, which makes the illustration rough, but the direction holds. The longer the evaluation window, the more the odds move above the point where loss aversion dominates.
Shlomo Benartzi and Richard Thaler named this combination myopic loss aversion in their 1995 paper, Myopic Loss Aversion and the Equity Premium Puzzle. They argued that investors who evaluate their holdings about once a year, together with loss aversion, would demand just the large equity premium observed in the data. Experimental work by Uri Gneezy and Jan Potters, in a 1997 paper titled An Experiment on Risk Taking and Evaluation Periods, supports the mechanism. Participants who received feedback on their risky investments more frequently chose to take less risk than those who saw results in aggregate, even though the underlying gamble was the same.
The behaviour that follows from this is costly. Brad Barber and Terrance Odean’s 2000 study, Trading Is Hazardous to Your Wealth, found that the households that traded most earned markedly lower net returns than those that traded least. Looking and trading are different acts, yet the first is the gateway to the second, because the urge to act grows with the number of times you are shown a loss.
What the Drawdown Record Says About Looking Away
A fair objection to all this is that favourable long-run odds hide very real pain, and the verified record of major S&P 500 drawdowns since 1973 shows it. The global financial crisis fell 57%, took 73 weeks to reach its bottom, and needed 207 weeks, about four years, to recover fully. The dot-com crash fell 49% over 135 weeks and took 384 weeks to recover, more than seven years. The 1973 to 1974 bear market fell 48%, bottomed after 93 weeks, and needed 374 weeks to recover. Black Monday in 1987 fell 34% and recovered in 98 weeks. The COVID crash fell 34% in only five weeks and recovered in 21. The 2022 bear market fell 25%, bottomed after 40 weeks, and recovered in 68.
Looking away shortens none of those intervals. Its value lies in reducing the number of occasions on which you are tempted to convert a temporary decline into a permanent loss. An investor who watched the global financial crisis daily faced several hundred observations of compounding bad news, and that accumulation is what makes selling at the bottom feel rational at the time. Someone reviewing quarterly still sees the drawdown, but through a handful of snapshots. The broader history of long-cycle bear markets is worth studying separately for how these episodes unfold.
The current market illustrates a subtler point about reference points. As of late October 2026, the S&P 500 sat at about 7,740, roughly 1.3% below its 52-week high of 7,845. Its 200-week simple moving average stood near 5,763, which puts the index about 34.3% above that long-cycle average, and the VIX read 17.2, in the normal range. A reading that far above the long-cycle average carries no forecast of a decline, and the history of the S&P 500 relative to its 200-week SMA includes stretches where prices stayed elevated for years. For a daily checker, the more relevant implication is that the mental baseline is anchored near a peak. Loss aversion measures every move against the reference point, so a market at highs makes even a routine 2% pullback register as a loss of recent wealth.
The 200-week average also moves very slowly. It spans just under four years of weekly closes, so it shifts by only small increments from one week to the next. A reference built on a window that long suits an occasional glance, which is why the 200-week SMA explainer treats it as a long-cycle reference and never as a daily alert.
Automation That Protects You From Yourself
Discipline works better as a system than as willpower. The aim is to make the right action the default and to place any wrong action behind friction. Several mechanisms do that work, and they combine well.
Automatic contributions on payday sit at the foundation. Money that moves from the paycheck to a broad index fund before you see it never faces a decision, and regular fixed-dollar purchases buy more shares when prices fall, which is the dollar-cost averaging effect in its simplest form. Thaler and Benartzi’s 2004 paper, Save More Tomorrow: Using Behavioral Economics to Increase Employee Saving, extended the idea by committing participants in advance to raise their contribution rate whenever their pay rose, and savings rates rose substantially as a result. Pre-commitment beats in-the-moment resolve.
Automatic rebalancing handles the second hardest decision. Selling what has risen and buying what has fallen runs against every emotional instinct, so a rule that does it for you, through an all-in-one fund, a target-date fund, or a calendar-driven instruction, removes a common point of failure. The investor who rebalances by rule buys equities after a drawdown without having to feel brave about it.
Product choice can add friction too. Index mutual funds price once at the end of the day and carry slightly more redemption friction than exchange-traded funds, which can protect investors who know they overtrade or panic-sell. The comparison of index funds and ETFs covers why that structural difference matters more than most investors expect, and why recurring purchases in exact dollar amounts suit a mutual fund well.
Environment design matters as much as product design. Removing the brokerage app from your phone’s home screen, turning off price alerts, and replacing a live dashboard with a monthly or quarterly statement all reduce the number of observations. A written investment policy statement adds another layer. Drafting, while calm, the conditions under which you would change allocation, such as a change in life goals or time horizon rather than a fall in prices, gives you something to read when the market makes you want to act. Investors who want a rule for deploying extra cash during weakness can write that down in advance as well, and the Buy the 200 strategy guide sets out one such framework built on the long-cycle average.
Decide when you are calm and act when you are not. Automation and written rules let the calm version of you make every important decision in advance.
A Practical Review Calendar
A review calendar replaces the vague intention to check less with something specific. A workable version has one quarterly session of perhaps thirty minutes, in which you confirm that contributions went through, compare the actual allocation with the target, and rebalance if any asset class has drifted beyond a tolerance band you set in advance. One annual session then handles the larger questions, such as whether the savings rate can rise, whether goals have changed, and whether fees remain low.
Between those sessions, the default is no action. Valuation indicators like the Shiller CAPE ratio or the Buffett indicator have their place in shaping long-run return expectations, but they make poor reasons to open an app on a random Wednesday. Much of the long-term result in Buffett’s record comes from long stretches in which nothing was done, a theme developed in Buffett’s real edge as patience, and an investor who interrupts those stretches pays for it.
Context still matters, and a few cases justify closer monitoring. A concentrated position in a single company can change its risk profile quickly, and an investor using leverage faces margin mechanics that ignore a quarterly schedule. Someone within a few years of retirement is exposed to sequence-of-returns risk and should review the cash buffer that funds withdrawals. For each of these, the right response is to monitor the specific risk, such as a position size or a runway of spending reserves, on a defined cadence, and to leave quote watching out of it.
One last caution concerns valuation at the time of action. The benefit of staying invested through a drawdown depends partly on what you paid. Recovery times in the verified record range from 21 weeks after the COVID crash to 384 weeks after the dot-com crash, and starting valuation helps explain a good part of that spread. Infrequent checking improves your odds of staying invested, and the price you paid still shapes the return you earn while you stay.
Frequently Asked Questions
Q: How often should I check my investment portfolio?
A: For a long-term index investor, once a quarter is enough and once or twice a year is reasonable. Use those reviews to confirm contributions, check the allocation against its target, and rebalance if it has drifted.
Q: What percentage of days does the S&P 500 go down?
A: The index closes lower on a little under half of all trading days, which still means more than a hundred red days in a typical year. Annual and multi-year views show far fewer losses, which is why the interval you check at changes how risky the same portfolio feels.
Q: What is myopic loss aversion?
A: Myopic loss aversion is the combination of feeling losses roughly 2.25 times as strongly as gains and evaluating results over very short intervals. Shlomo Benartzi and Richard Thaler described it in 1995, and it explains why frequent checking makes a positive-expectation investment feel unpleasant.
Q: Does checking less often mean ignoring risk?
A: Checking less often still allows you to monitor the risks that matter, such as concentration, leverage, and the cash reserve that funds retirement withdrawals. It moves attention from daily price quotes to a fixed schedule, which cuts exposure to noise while keeping oversight in place.