№ 025 · Deep Dive · · 13 min
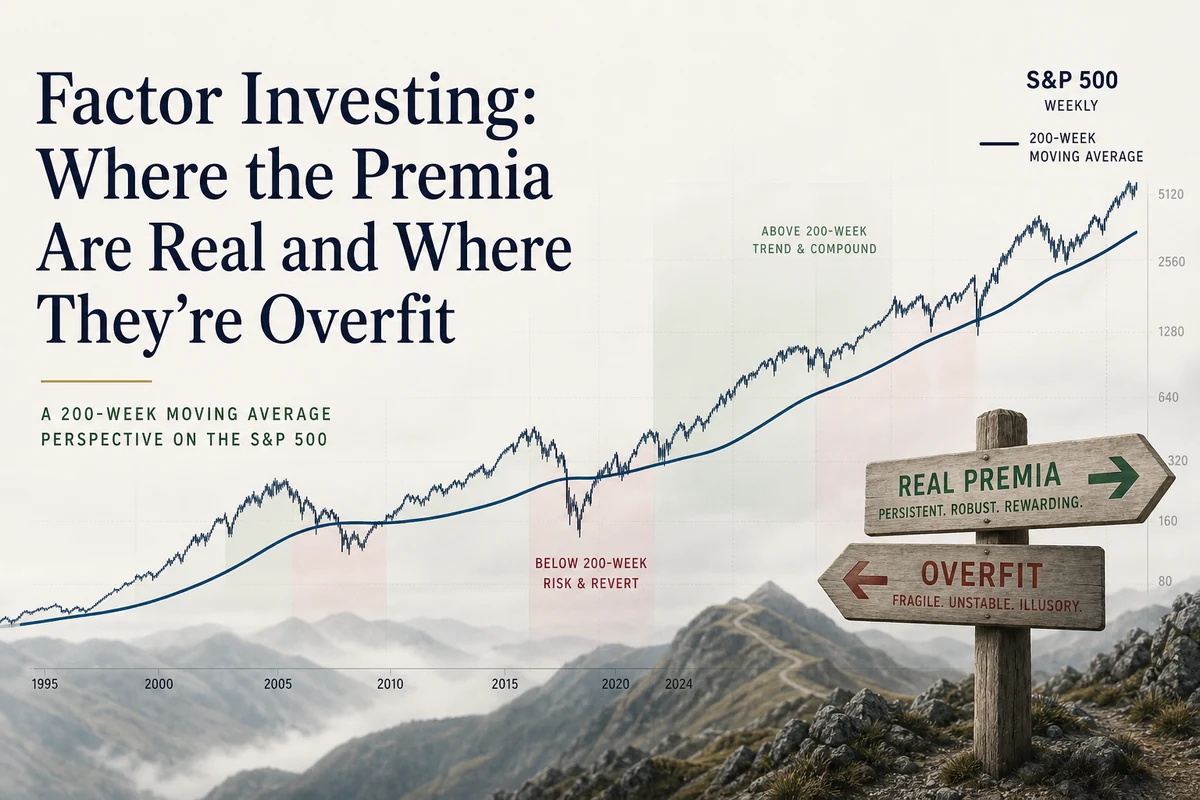
Factor Investing: Where the Premia Are Real and Where They’re Overfit
Not all factors are created equal. Discover which premia have survived out-of-sample scrutiny, which are likely data mining artifacts, and what it truly costs to capture them.

Factor investing sounds like the best of all worlds: the systematic discipline of passive investing, combined with a deliberate tilt toward characteristics that academic research says produce superior long-run returns. Buy cheap stocks, or high-momentum ones, or companies with strong profitability, and collect a premium the market apparently offers to patient holders. The pitch is compelling enough that hundreds of smart beta ETFs now exist to package these ideas for retail investors. The problem is that the underlying evidence is far messier than the marketing suggests. Some factors are well-grounded in decades of data spanning multiple countries. Others are almost certainly artifacts of statistical mining through historical returns. Knowing which is which is not optional if you plan to allocate real money.
What a Factor Actually Is, and Why the Question Matters
A factor, in the formal sense, is a measurable characteristic of a security that has been shown to explain differences in risk-adjusted returns over time. The original one-factor model, the Capital Asset Pricing Model, said that market beta, or sensitivity to broad market movements, was the only systematic driver of expected return. Fama and French’s seminal 1992 and 1993 papers challenged that directly by showing that size and book-to-market ratio explained return variation that beta alone could not. Their three-factor model was followed by Jegadeesh and Titman’s documentation of cross-sectional momentum in the early 1990s, and then by Fama and French’s own expansion to a five-factor model in 2015, adding profitability and investment as additional systematic return drivers.
That progression sounds orderly. What happened next was not. Researchers, armed with expanding datasets and computational power, began testing every imaginable characteristic for predictive power. Academic journals, which are more likely to publish positive findings than null results, created a structural incentive to report the factors that worked in a given sample. By some counts, more than four hundred distinct factors have appeared in peer-reviewed finance literature. In a 2019 paper, Rob Arnott, Campbell Harvey, and colleagues argued that the majority are likely the product of data mining rather than genuine economic effects. The term “factor zoo” stuck.
When researchers test hundreds of variables against the same historical dataset, some will appear significant by chance alone. The question is not whether a factor worked in-sample. The question is whether it continues to work after publication, in different geographies, and across time periods the original research never touched.
That distinction between in-sample fit and out-of-sample validity is the central issue in factor investing. McLean and Pontiff (2016) examined 97 published equity factor strategies and found that post-publication premiums fell by an average of roughly 32% compared to the figures reported in the original research. Part of that decay reflects arbitrage, capital flowing toward the known anomaly until it narrows. But part of it reflects the simpler truth that the in-sample result was never as strong as it appeared.
The Factors With the Strongest Claim to Reality
Value is the oldest and most studied premium. The idea, formalized by Fama and French’s HML factor (high book-to-market minus low book-to-market), is that cheap stocks, measured relative to their assets or earnings, tend to outperform expensive ones over long periods. The international evidence is reasonably consistent: a study of Canadian data from 1985 to 2005 found a persistent value premium that held across bull and bear markets, through recessions and recoveries, and survived when firm size was controlled for. Fama and French’s own international data showed an average value premium of approximately 7.68% annually from 1975 to 1995 across non-US developed markets. The mechanism has two competing explanations. One is rational risk compensation: value stocks tend to be distressed businesses carrying genuine operational risk, and investors require higher returns to hold them. The other is behavioral, rooted in investor overextrapolation of recent poor performance. Evidence suggests both forces are at work simultaneously, which is arguably why the premium has been durable despite widespread awareness.
The important caveat is that the value premium has been concentrated in small-cap stocks and in periods of economic stress. Asness and colleagues noted that there is no strong standalone value premium among large-cap stocks, and the premium in small-cap value has itself weakened in more recent decades. A value tilt in a large-cap-only portfolio may therefore be capturing far less than the historical record implies. The Shiller CAPE on the S&P 500 currently sits at 41.66, well above its long-run average, which suggests growth expectations remain elevated relative to value, and the conditions for a sharp mean reversion in factor spreads are present, though not guaranteed to resolve on any particular schedule.
Momentum may be the most empirically robust of all the major factors, which is precisely what makes it theoretically awkward. Stocks that have performed well over the prior six to twelve months tend to continue outperforming over the next one to twelve months. The effect has been documented across equity markets in the US, Europe, and emerging markets, in bond markets, in currencies, and in commodities. It persists in more recent data and shows limited evidence of the post-publication decay that afflicts weaker factors. Nearly ninety years after Cowles and Jones first documented serial correlation in stock returns, cross-sectional momentum remains a live anomaly. The challenge for theorists is that no clean risk-based story explains it. The Fama-French five-factor model deliberately excludes momentum for this reason. Behavioral explanations, particularly initial underreaction to new information followed by overreaction, fit the data reasonably well. For investors, the practical constraint is that momentum strategies carry high turnover, which generates meaningful transaction costs and potentially unfavorable tax consequences in taxable accounts.
Quality and profitability have accumulated strong evidence since Fama and French’s five-factor extension. Profitable firms, measured by operating profitability relative to book equity, consistently outperform unprofitable ones after controlling for size and value. The quality factor more broadly encompasses high profitability, low leverage, stable earnings, and strong cash flow generation. Crucially, profitability has a documented ability to improve the performance of value strategies: a cheap stock that is also profitable is historically superior to a cheap stock with deteriorating fundamentals. The combination reduces the “value trap” problem that afflicts naive cheap-stock screens. Profitability’s evidence is also credible because there is a plausible rational explanation, namely that genuinely good businesses deserve a premium, alongside a behavioral one, that investors systematically underestimate the persistence of high returns on capital.
Low volatility presents the most intellectually interesting challenge to standard finance theory. Portfolios of low-beta or low-volatility stocks have historically produced returns comparable to or exceeding the broader market, with less risk. This flatly contradicts the core prediction of the CAPM that more risk should mean more return. Research from AQR Capital Management on defensive equity demonstrated that high-beta stocks, despite receiving the majority of a typical portfolio’s risk budget, have historically returned approximately the same as low-beta stocks. Explanations range from structural constraints, such as leverage-averse institutional investors bidding up risky stocks to chase returns within a mandate, to pure mispricing by retail investors attracted to lottery-like payoffs. Whether the source is rational or behavioral, the anomaly has survived extensive out-of-sample testing across international markets and across decades.
Where the Evidence Is Thin or Overfit
Beyond these core factors, the picture deteriorates quickly. The size premium, the original Fama-French SMB factor, provides a useful case study. From 1926 through approximately 2006, the average SMB return was roughly 0.23% per month, and the premium was consistent across sub-periods. Since then, the evidence has weakened materially. Large-cap earnings multiples expanded so dramatically that the benchmark itself rose in ways that compressed the relative advantage of small stocks. Critically, broad small-cap indices mix genuinely undervalued businesses with structurally declining ones, meaning an undifferentiated small-cap tilt often captures beta exposure rather than any genuine premium. The size effect appears most alive in international markets and when explicitly combined with quality screens, but realistic forward expectations for a size tilt alone should be modest.
Below these established factors, the catalog of proposed anomalies spans accruals, asset growth, net operating assets, earnings quality, share issuance patterns, and dozens more. Many of these show impressive backtested returns and fade considerably after publication. The mechanism is not purely arbitrage. Data mining is a significant part of the explanation: a researcher running enough variables through enough historical periods will inevitably find patterns that are statistical accidents. Arnott and Harvey’s 2019 work argued directly that the statistical threshold for claiming a genuine factor should be substantially higher than the conventional significance levels that academic journals typically require, precisely because so many specifications are being tested on the same underlying data.
The problem with the factor zoo is not just that many entries are spurious. It is that even genuine factors can be exploited in ways that destroy most of their value. A factor that earns a meaningful annual premium in a clean academic long-short portfolio may deliver near-zero net alpha when implemented through a long-only ETF, after fees, taxes, and timing risk are accounted for.
The Real Costs of Capture
Academic factor premia are almost always reported gross of costs, in idealized long-short portfolios that no retail investor can implement, and based on historical periods that may include regimes that no longer apply. Converting that theoretical premium into actual investor returns requires clearing several hurdles simultaneously.
Turnover is the most obvious cost. Momentum strategies, by their nature, require frequent rebalancing as leadership in the market rotates. High turnover generates transaction costs, bid-ask spreads on less liquid names, and in taxable accounts, short-term capital gains taxed at ordinary income rates. A momentum factor that earns an attractive gross premium may produce mediocre net returns for a taxable investor holding a physical ETF. Value strategies tend to have lower turnover but create their own challenge: the willingness to hold positions through extended periods of underperformance, sometimes lasting years or even a full market cycle. Research Affiliates’ Rob Arnott, Amie Ko, and Lillian Wu documented directly in their paper “Where’s the Beef?” that as assets managed by smart beta and factor strategies grow, implementation costs have contributed to a widening gap between backtested results and live outcomes. They also identified the problem of “revaluation alpha,” where a factor appears to outperform in backtests partly because the valuation multiples assigned to factor-tilted portfolios expanded during the sample period rather than reflecting a persistent structural premium.
Timing risk is equally important and less often discussed. Every major factor experiences multi-year periods of significant underperformance relative to the market. The value factor’s decade-long lag through the 2010s is the most visible recent example. Low-volatility portfolios underperform sharply during the strongest bull markets. Momentum can crash suddenly and severely when market regimes shift, as it did in 2009. Investors who implement factor strategies must have both the intellectual conviction to hold through drawdowns and the financial structure that lets them do so without being forced to sell at the wrong moment. Most individual investors overestimate their tolerance for tracking error against a familiar benchmark. The behavioral risk of abandoning a factor tilt at exactly the wrong point is not a minor footnote, it is one of the primary reasons realized factor returns for actual investors typically fall well short of the theoretical premiums.
How to Think About Factor Tilts in a Long-Term Portfolio
The starting point for any serious investor should be a simple, low-cost, market-cap-weighted index fund. The S&P 500 or a broader global index like the MSCI World provides exposure to the market factor at minimal cost, with no turnover-driven tax drag and no multi-year tracking error to endure. The evidence on active management over 20-year horizons is clear enough that this baseline deserves genuine respect before any tilt is considered. The Buy the 200 strategy framework captures this logic well: systematic, long-term, cost-conscious participation in broad market compounding is the foundation, not a consolation prize.
A selective factor tilt makes sense only when several conditions are genuinely met. The factor must have out-of-sample evidence across geographies and time periods. The investor’s holding horizon must be long enough, arguably a minimum of ten years, to allow the premium to express itself through at least one full market cycle. Implementation costs, including the expense ratio of any ETF or fund, rebalancing friction, and tax drag in taxable accounts, must be explicitly estimated and accepted as a realistic reduction to the theoretical gross premium. And the investor must honestly assess whether they will maintain the position through a three- or four-year period of underperformance without abandoning it, because that period is not an exception in the historical record, it is a regular feature.
Among the better-evidenced choices, quality and profitability tilts are arguably the most practical for long-horizon investors. The evidence is credible, the turnover is moderate, the behavioral story is intuitive, and the combination with value screens reduces exposure to value traps. Momentum is real but expensive to capture efficiently in long-only, low-cost form. Low volatility deserves attention for investors whose primary concern is capital preservation through bear markets rather than maximizing terminal wealth. The 200-week SMA’s historical behavior across market cycles illustrates how a long-cycle technical filter can complement a factor framework by reducing exposure during the most severe drawdowns, without requiring the impossible task of forecasting precisely when those drawdowns will arrive.
A more grounded conclusion from decades of factor research is that a handful of premia appear real, several more are probably spurious, and all of them are harder and more expensive to harvest than academic papers suggest. The investor who captures two-thirds of a genuine factor premium through a simple, low-cost vehicle and holds it through a full cycle will almost certainly outperform the investor who chases the most recent backtest in a crowded strategy.
Frequently Asked Questions
Q: How many factors have genuine out-of-sample evidence?
A: Of the hundreds proposed in academic literature, a small number have been validated across geographies, time periods, and different datasets. Value, momentum, quality and profitability, and low volatility each have meaningful out-of-sample support. The size premium is more contested and appears strongest when combined with quality filters. Everything beyond these core factors should be treated with substantial skepticism, as many appear to be statistical artifacts of mining large historical datasets.
Q: Why do factor premiums shrink after academic publication?
A: Two forces operate simultaneously. First, genuine arbitrage: once a premium is publicly documented, capital flows toward the strategy and narrows the spread. Second, many premiums were never as strong as the published research implied, because data mining through historical returns produces patterns that do not persist. McLean and Pontiff’s 2016 research documented that premiums across a broad sample of published strategies declined materially after publication on average, suggesting both mechanisms are at work.
Q: Is a smart beta ETF a better choice than a plain index fund?
A: For most investors with horizons under ten years and in taxable accounts, a plain market-cap index fund is likely to outperform a smart beta alternative on a net-of-costs basis. Factor ETFs typically carry higher expense ratios, higher turnover, and require the patience to endure multi-year underperformance. For a long-horizon investor with a tax-advantaged account and genuine conviction in a specific factor’s economic rationale, a modest tilt toward quality, value, or profitability can be reasonable, but it should be sized modestly and held patiently rather than rotated in response to recent performance.
Q: Should factor tilts change based on market valuations?
A: There is some evidence that factor premia are larger when valuation spreads are wide. With the Shiller CAPE currently at 41.66 and the US market broadly stretched by historical standards, the relative spread between value and growth is unusually wide in certain segments. That creates a theoretically more attractive setup for a value tilt than was available a decade ago. However, valuation spreads can widen further before they compress, and timing factor rotations precisely is as difficult as timing the broader market. A steady, modest allocation maintained across market cycles is more likely to capture the available premium than any attempt to shift weights based on current conditions.