№ 028 · Almanac · · 1 min
What we learned the week NVDA hit its 200-week SMA in 2019.
NVDA touched its 200-week line in 2019. Twelve months later: +162.1%.

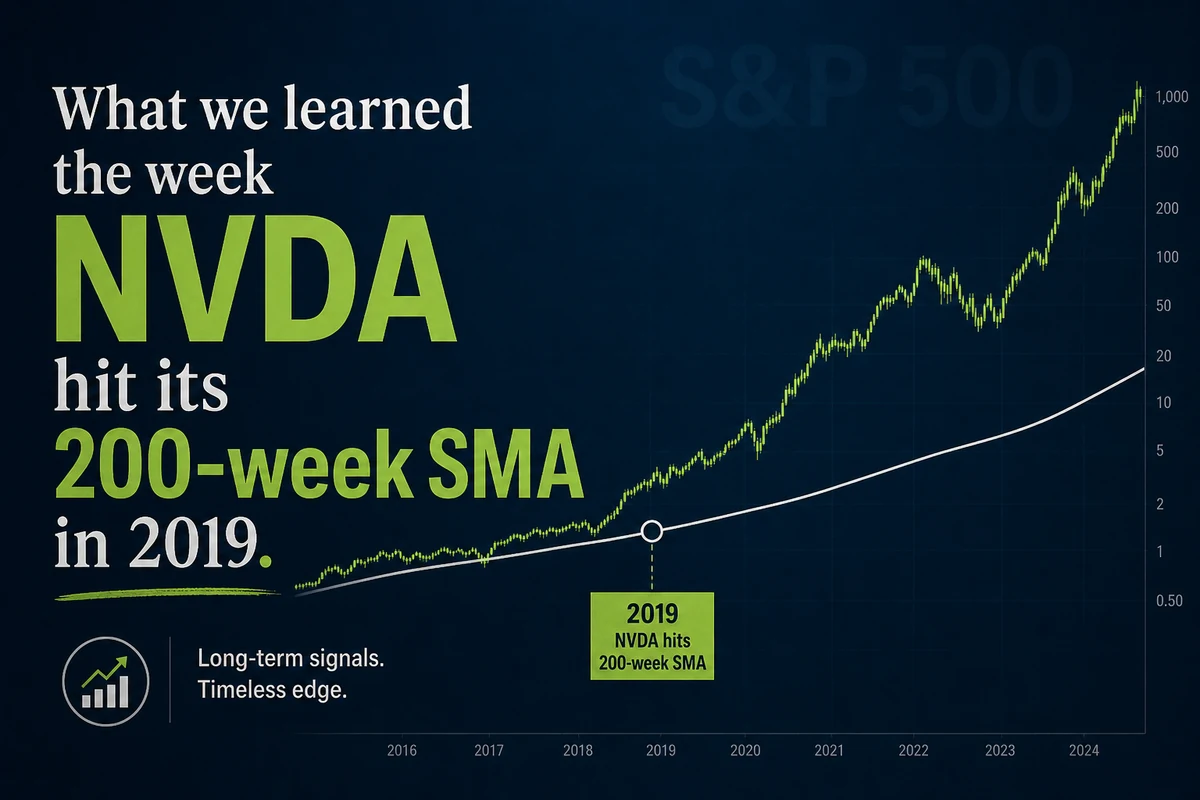
On the week of May 27, 2019, NVDA touched its 200-week moving average at $3.39. The SMA itself was sitting at $3.35.
Twelve months later: +162.1%. Three years later: +455.5%. Five years later: +3,043.9%.
7 years on, NVDA trades at $215.33, +6,258.5% from the touch.
, The 200-week SMA as a trend filter does not predict, it confirms.